


This piece is the deep-dive follow-through on one of our Q2 themes: shareholder return and dividends in China, which we flagged in our first Pro issue.
Why investing for income is a good strategy now
A decade ago, this would have been a very different conversation. Chinese equities were sold as growth. The idea of buying stocks for income — just for the yield — wasn't the consensus pitch.
Back then, the baseline expectation was to chase strategies or products yielding somewhere north of 10%. For decades, China’s rapid economic expansion created enormous opportunities to cash in on the secondary market—particularly in the high-flying internet names. In that environment, investing for dividends felt a bit "boring" compared to the hyper-growth happening elsewhere. Plus, the risk-free rate was generous enough that seeking out dividend stocks wasn't an imperative.
That has changed. We are now seeing a convergence of several factors at once:
China’s economy has entered a lower-growth, stabilization phase. In this environment, companies that reliably return capital are worth more than they used to be — the market is gradually pricing that shift.
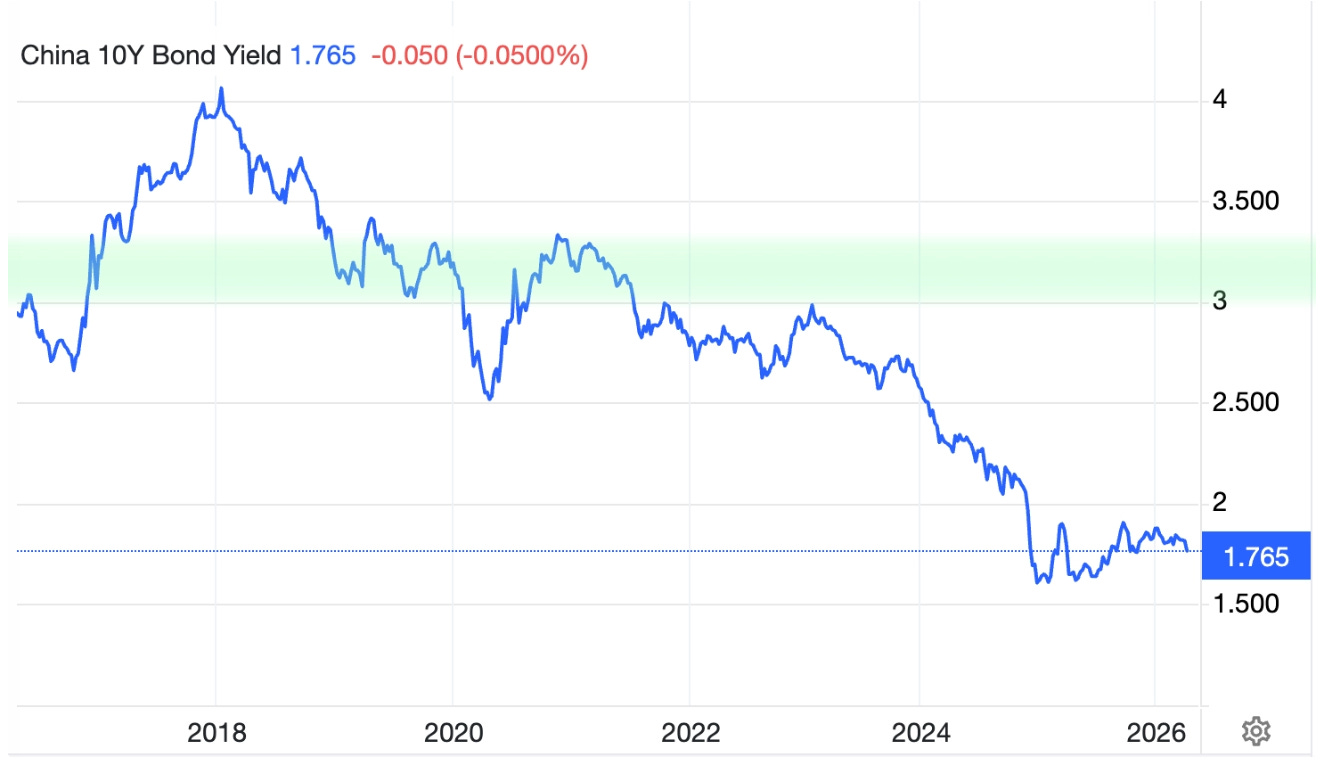
Meanwhile, the domestic rate backdrop has tilted sharply: China’s 10-year government bond yield has fallen below 2%, a level that was almost unimaginable five years ago. At that rate, a basket of A-shares yielding 4–7% in combined dividend and buyback yield carries a meaningful spread. That’s not lost on domestic institutional investors or on insurance companies structurally seeking income.
Third — and this is the part that probably goes under the radar for most international investors — regulation has mandated it.
As early as 2008, the CSRC mandated that listed companies seeking equity refinancing must have distributed at least 30% of average annual profits as cash dividends over the preceding three years. In December 2023, the CSRC revised its Guideline No. 3 on cash dividends, strengthening disclosure requirements for non-dividend-paying companies, simplifying interim dividend procedures, and encouraging higher payout frequency. In 2024, it went further: the November Guidelines for Listed Companies No. 10 — Market Value Management explicitly charged company boards with actively managing their market capitalization, through dividends, buybacks, investor relations, and M&A. Capital return is now a governance expectation, not a voluntary option.
The results are showing up in the data. Listed onshore Chinese companies (A-shares) paid a record 2.64 trillion yuan in dividends in 2025, surpassing the previous record of 2.4 trillion yuan set in 2024 [*]. Share buybacks have also seen a massive structural leap. In 2025, 1,495 A-share companies initiated share buyback programs, with the cumulative value reaching 142.84 billion yuan.
More importantly, the nature of these buybacks has fundamentally shifted. Moving away from traditional repurchases for employee stock ownership plans, cancellation-oriented buybacks (aimed at reducing share capital) increased markedly. In 2025, over 40% of all buyback plans were intended for full or partial cancellation, up from 38.33% in 2024 (wind).
The policy tailwind has only grown stronger. The 300 billion yuan re-lending facility launched by the PBOC in October 2024 was further optimized in May 2025. It is now part of a combined 800 billion yuan pool (shared with the Securities, Funds, and Insurance companies Swap Facility), specifically designed to provide high-velocity liquidity for buybacks and major shareholder stake increases [*].
This is a coordinated policy push, not a corporate governance fad. The combination of regulatory mandate, suppressed domestic rates, and a conscious SOE pivot toward shareholder return has created a structural backdrop that simply didn't exist in prior China market cycles.
The quasi floor: A mechanism worth understanding
Here’s something we don’t see getting nearly enough attention in international coverage of China equities.
Under CSRC rules finalized in May 2024 — the Interim Measures for the Administration of Shareholders’ Reductions in Holdings — controlling shareholders and de facto controllers of listed companies are prohibited from reducing their holdings via secondary market transactions if any of the following apply:
The stock price has fallen below its IPO price
The stock price has fallen below net asset value per share
The company has not met dividend standards — specifically, cumulative cash dividends over the prior three years amount to less than 30% of average annual net profit
This creates what we’d call a quasi price floor. Not a hard floor — the state isn’t pledging to buy at a specific level. But a real incentive structure: a controlling shareholder who wants the optionality to monetize their position needs the company’s stock to stay above IPO price and NAV, and, most importantly, needs the company to maintain its dividend. That incentive doesn’t go away.
The practical effect is subtle but real. Companies with genuine cash generation are increasingly motivated to maintain and grow dividends — not purely because regulators want them to, but because their controlling shareholders’ own exit flexibility depends on it.
Instruments to invest in Chinese dividend stocks
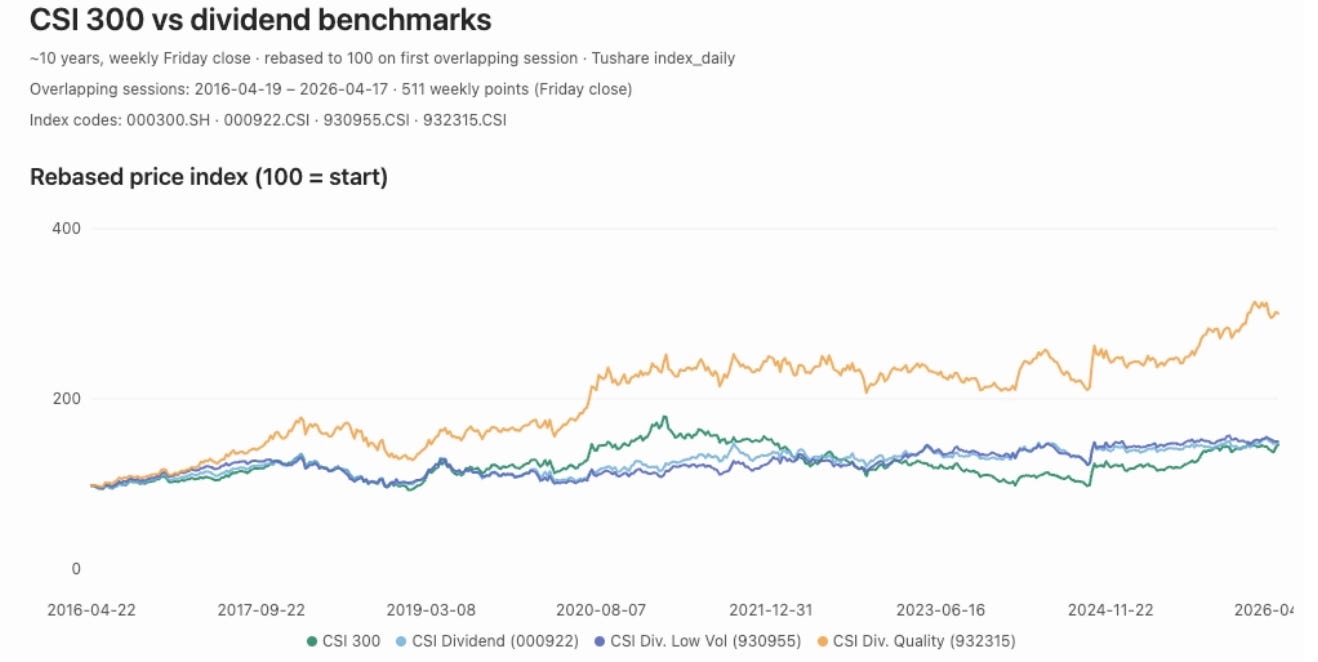
In the domestic A-share market, the CSI Dividend Index (000922) serves as the foundational benchmark. By tracking 100 of the most consistent dividend payers—those with at least three consecutive years of distributions—and weighting them by yield, it provides the most direct exposure to the theme. It is the baseline for the "income trade," currently yielding roughly 5.2%.
For the Hong Kong market, Global X Hang Seng High Dividend Yield ETF (03110.HK) is a good direct exposure, now yielding around 5.5%-6.5%.
What’s wrong with the existing benchmarks?
To be fair, these benchmark indices are solid instruments for broad exposure to the theme. Looking at the price history over the past decade, they have generally delivered price returns on par with the CSI 300, with dividends adding an additional layer of outperformance. In a persistent low-rate environment, these remain reasonable tools for asset allocation and income generation.
However, they do carry structural shortcomings that investors should consider:
1. Sector concentration
The CSI Dividend Index is structurally heavy in banks, coal, and energy. These sectors dominate on raw yield metrics: state banks provide consistent payouts, and coal companies have generated enormous cash throughout the recent commodity cycle. But a basket where banks alone can exceed 30% is not a diversified income strategy. Telecom, utilities, industrials, and selected consumer names all have robust dividend-paying businesses that often get systematically underweighted in these frameworks.
2. Over-reliance on “trailing yield” as a screening criterion
A high trailing dividend yield can signal three very different realities: a genuinely high-performing business, a collapsing share price, or a one-off special dividend that won’t recur. Index methodologies (such as the CSI Dividend Index) that place primary weight on trailing yield often fail to distinguish between them.
3. Absence of financial quality filters
Some companies sustain dividends by borrowing—a practice that is a risk, not a feature. Methodologies that don't filter for fundamental indicators—such as free cash flow quality, ROE, or earnings durability—effectively hide balance-sheet risk under an "income" label.
These issues are partially mitigated by more advanced index variants. The CSI Dividend Low Volatility Index (930955), for example, filters for stocks that pair high payouts with low price volatility, acting as a defensive anchor during market turbulence. For investors wary of "value traps," the CSI All Shares Dividend Quality Index (932315) overlays financial health indicators—such as net profit growth and ROE—alongside yields. This ensures that distributions are backed by genuine fundamental strength rather than depleting cash reserves. (This methodology results in much more diversified sector concentration; currently, Food & Beverages, Non-ferrous Metals (15.97%), and Autos occupy the top positions.)
4. Buybacks are excluded entirely
Perhaps the most significant flaw is that buybacks are excluded entirely from all major indices. While this is understandable given that the relevant policy changes are recent, we believe a "mindset shift" is now required: moving from a "dividend-only" view to a Total Shareholder Return (TSR) view.
Buybacks are now a core component of how Chinese companies return value. Indices that screen only for cash dividends miss this shift completely. A company running an aggressive buyback program—which supports the share price and increases earnings per share (EPS)—could be ignored by the index entirely. In the current regime, the old methodology is only looking at half the picture.
For instance, as China’s internet giants transition from hyper-growth stories to mature, cash-generative companies, they have increasingly leaned on buybacks as their primary tool for returning value. Tencent, for example, has committed to a massive share repurchase program in recent years; while its cash dividend yield typically hovers at a modest 1.5% to 2%, its "buyback yield" provides a much more substantial contribution to total shareholder return.
A-share screening: total shareholder yield
To get a more comprehensive picture of what companies are actually returning to shareholders in the A-share market, we conducted a systematic screening exercise. Rather than relying solely on trailing dividend yield — which is how most mainstream dividend indices rank their constituents — we incorporated buyback activity alongside dividends to arrive at a more complete measure of total shareholder yield.