


China’s vast and still-fast export engine has produced a large class of companies with real global influence. We screened Chinese companies listed in A-shares, Hong Kong and the U.S., using overseas revenue scale and global relevance as the primary test, with overseas growth, profitability and business quality as secondary filters. The result is the China Global Champions 30: thirty representative companies across five groups, together generating roughly USD 440 billion of overseas revenue. The companies are real. But turning this theme into a trade is much harder, and much more nuanced, than the headline suggests.
China today is not merely a large exporter. It is a super-exporter by any historical standard.
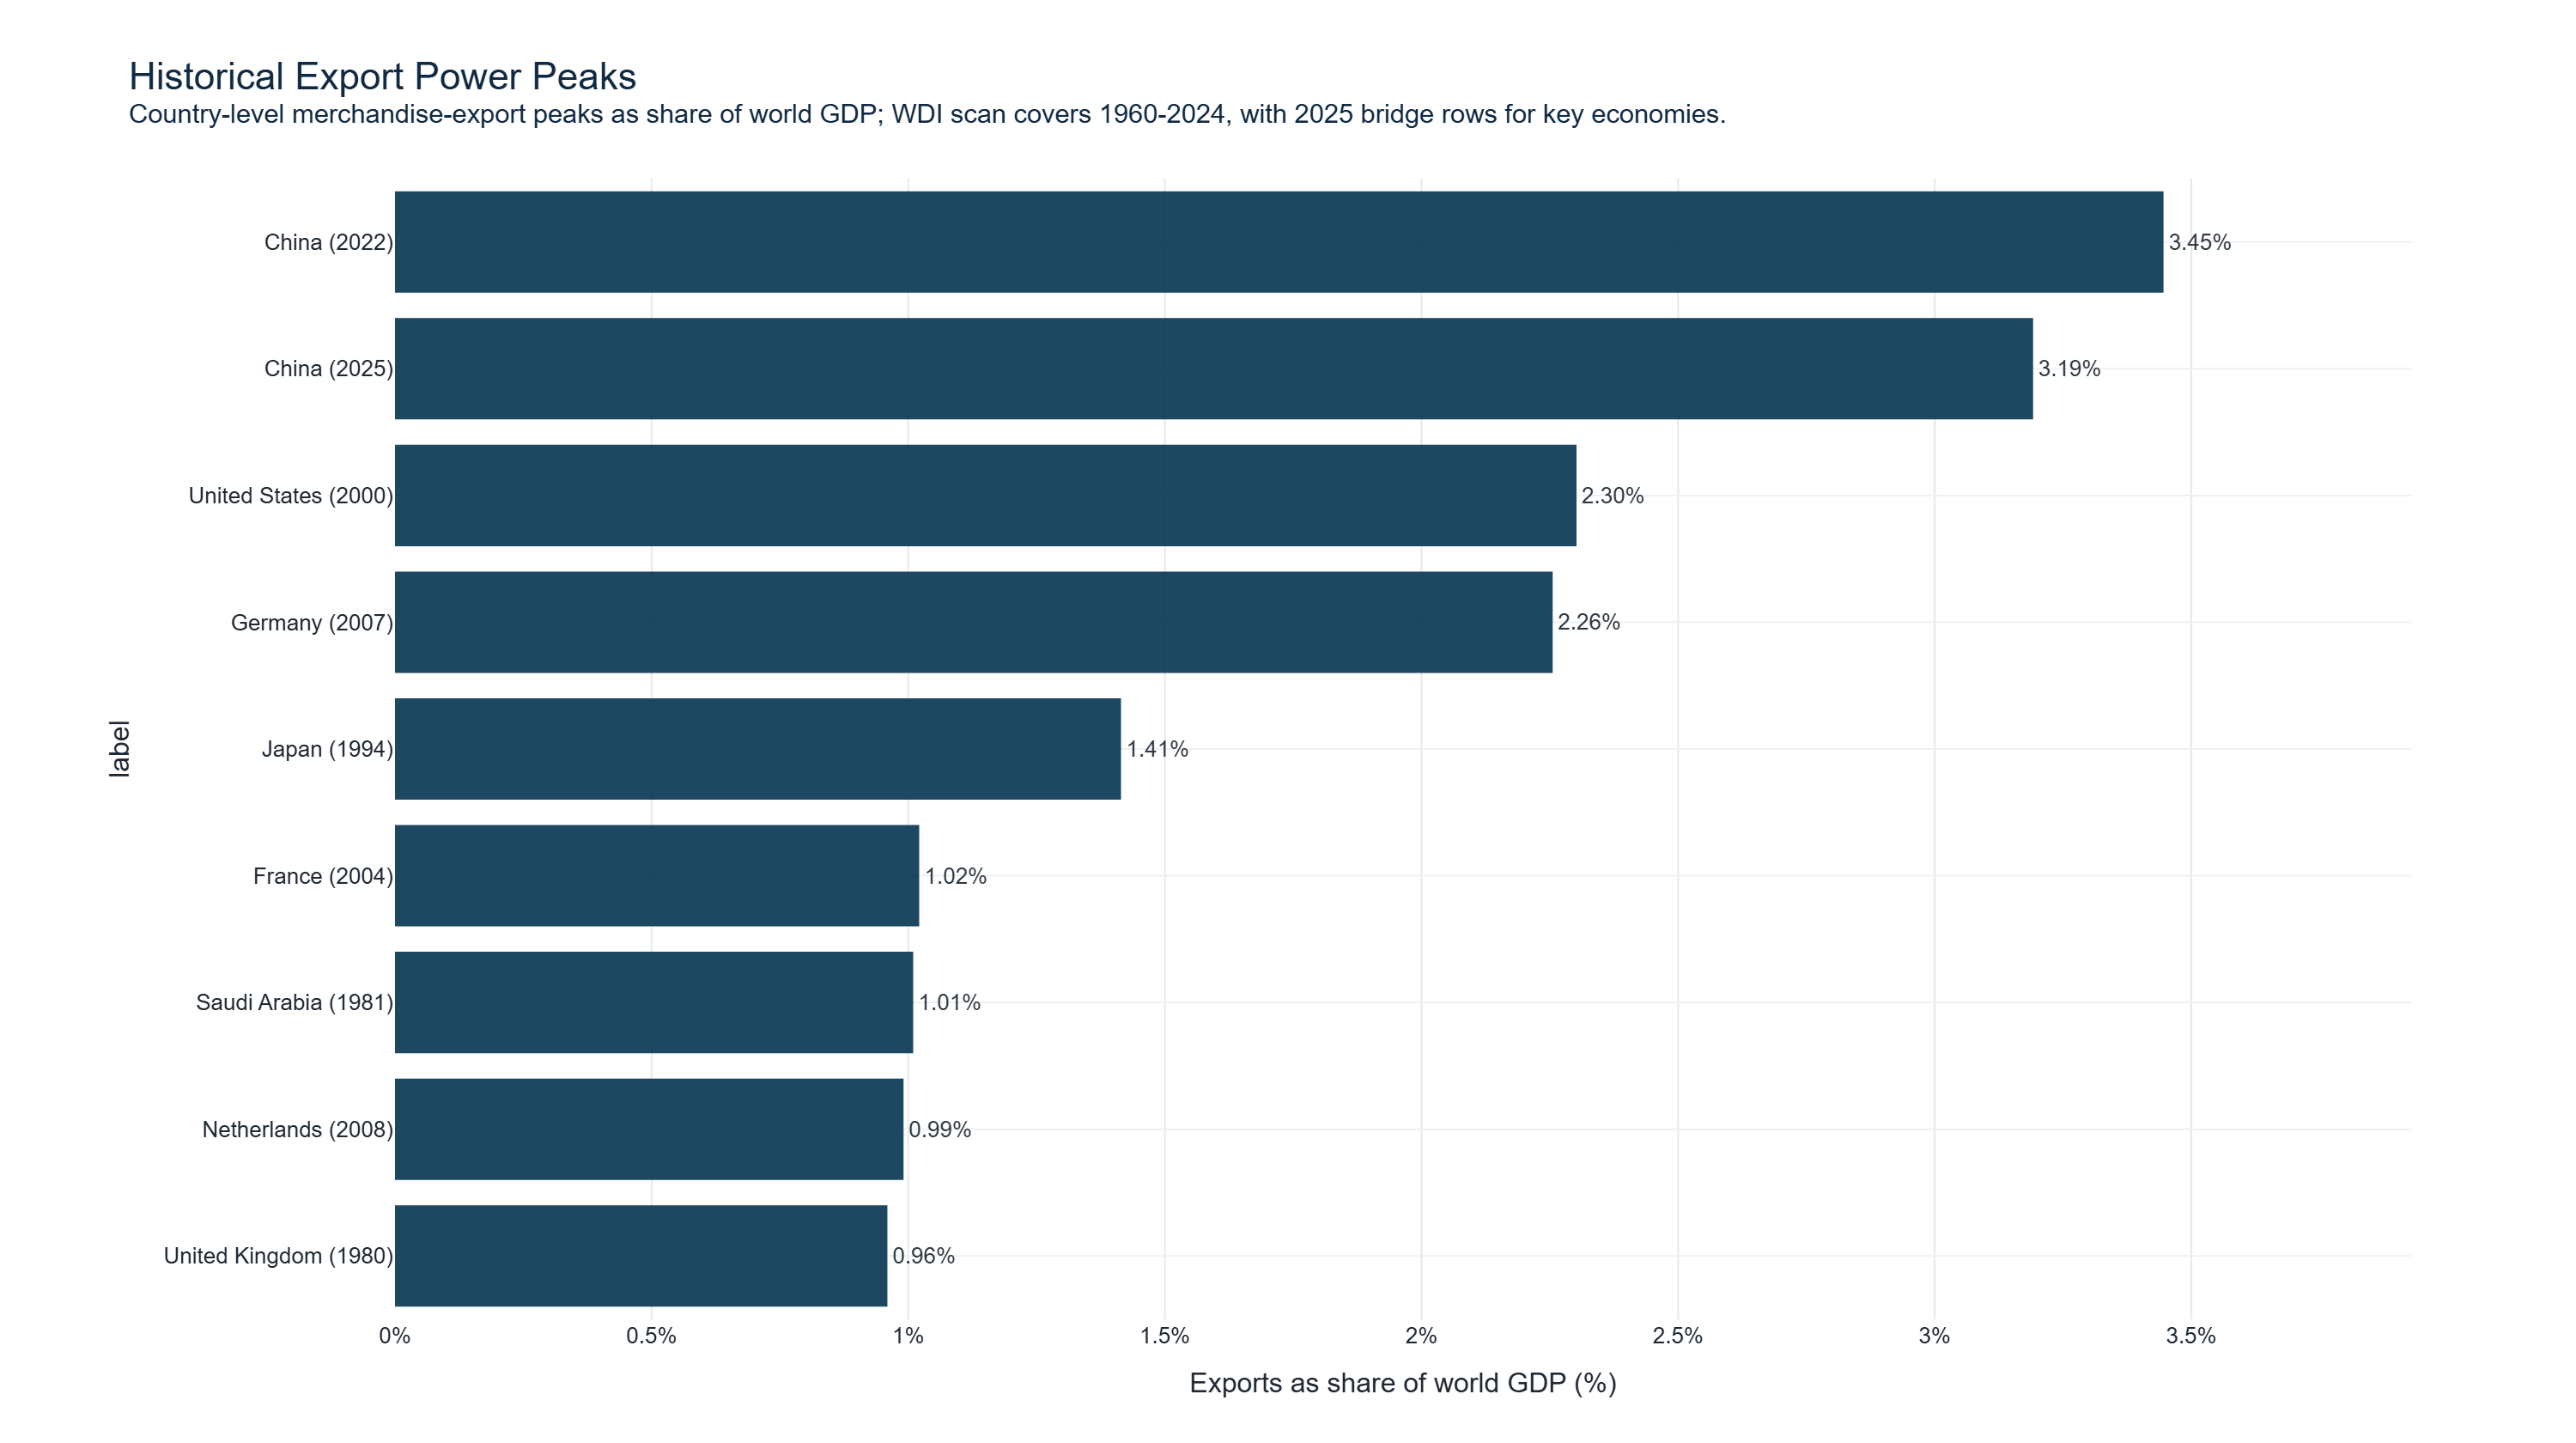
In 2025, China’s goods exports reached roughly USD 3.77 trillion, while its trade surplus rose to about USD 1.19 trillion. The scale is difficult to overstate. When we scan the modern World Bank/WDI record from 1960 onward, the historical peak is China in 2022: merchandise exports equal to about 3.45% of world GDP. China’s 2025 figure is slightly lower, at about 3.19%, but it still belongs to the same historically exceptional range and remains well above the peak levels reached by the United States, Germany, Japan or the United Kingdom in the modern data.
FIGURE 1
Historical Export Power Peaks
The composition has changed as well. China’s export machine is no longer defined mainly by garments, toys and low-value assembly. Batteries, electric vehicles, semiconductors, industrial equipment, automation hardware and AI supply-chain components now occupy a much larger part of the story.
That shift has made “China going global” one of the most attractive themes in equity investing. The logic sounds simple enough: China’s domestic demand remains weak, exports remain unusually strong, and listed companies with real overseas exposure should be able to deliver excess returns.
But once we studied the companies one by one, the story became much harder than that.
For this first piece in our quantitative series on Chinese companies going global, we scanned listed Chinese companies across A-shares, Hong Kong and the United States, then built what we call the China Global Champions 30. We deliberately started with scale. The primary criterion was overseas revenue: these companies had to generate a large and meaningful share of revenue outside mainland China, whether in developed markets or emerging markets.
We then used overseas revenue share, revenue growth, gross margin, ROE and business substance as secondary filters. The point was to avoid letting commodity-trading companies exaggerate their global scale. We also excluded state-owned enterprises, especially policy-supported financial institutions and state-linked commodity traders, where overseas revenue can be inflated by public resources, balance-sheet scale or trading flow rather than true market competitiveness.
The goal was not to find the most famous Chinese brands. It was to find listed Chinese companies whose global revenue base says something real about their competitiveness.
FIGURE 2
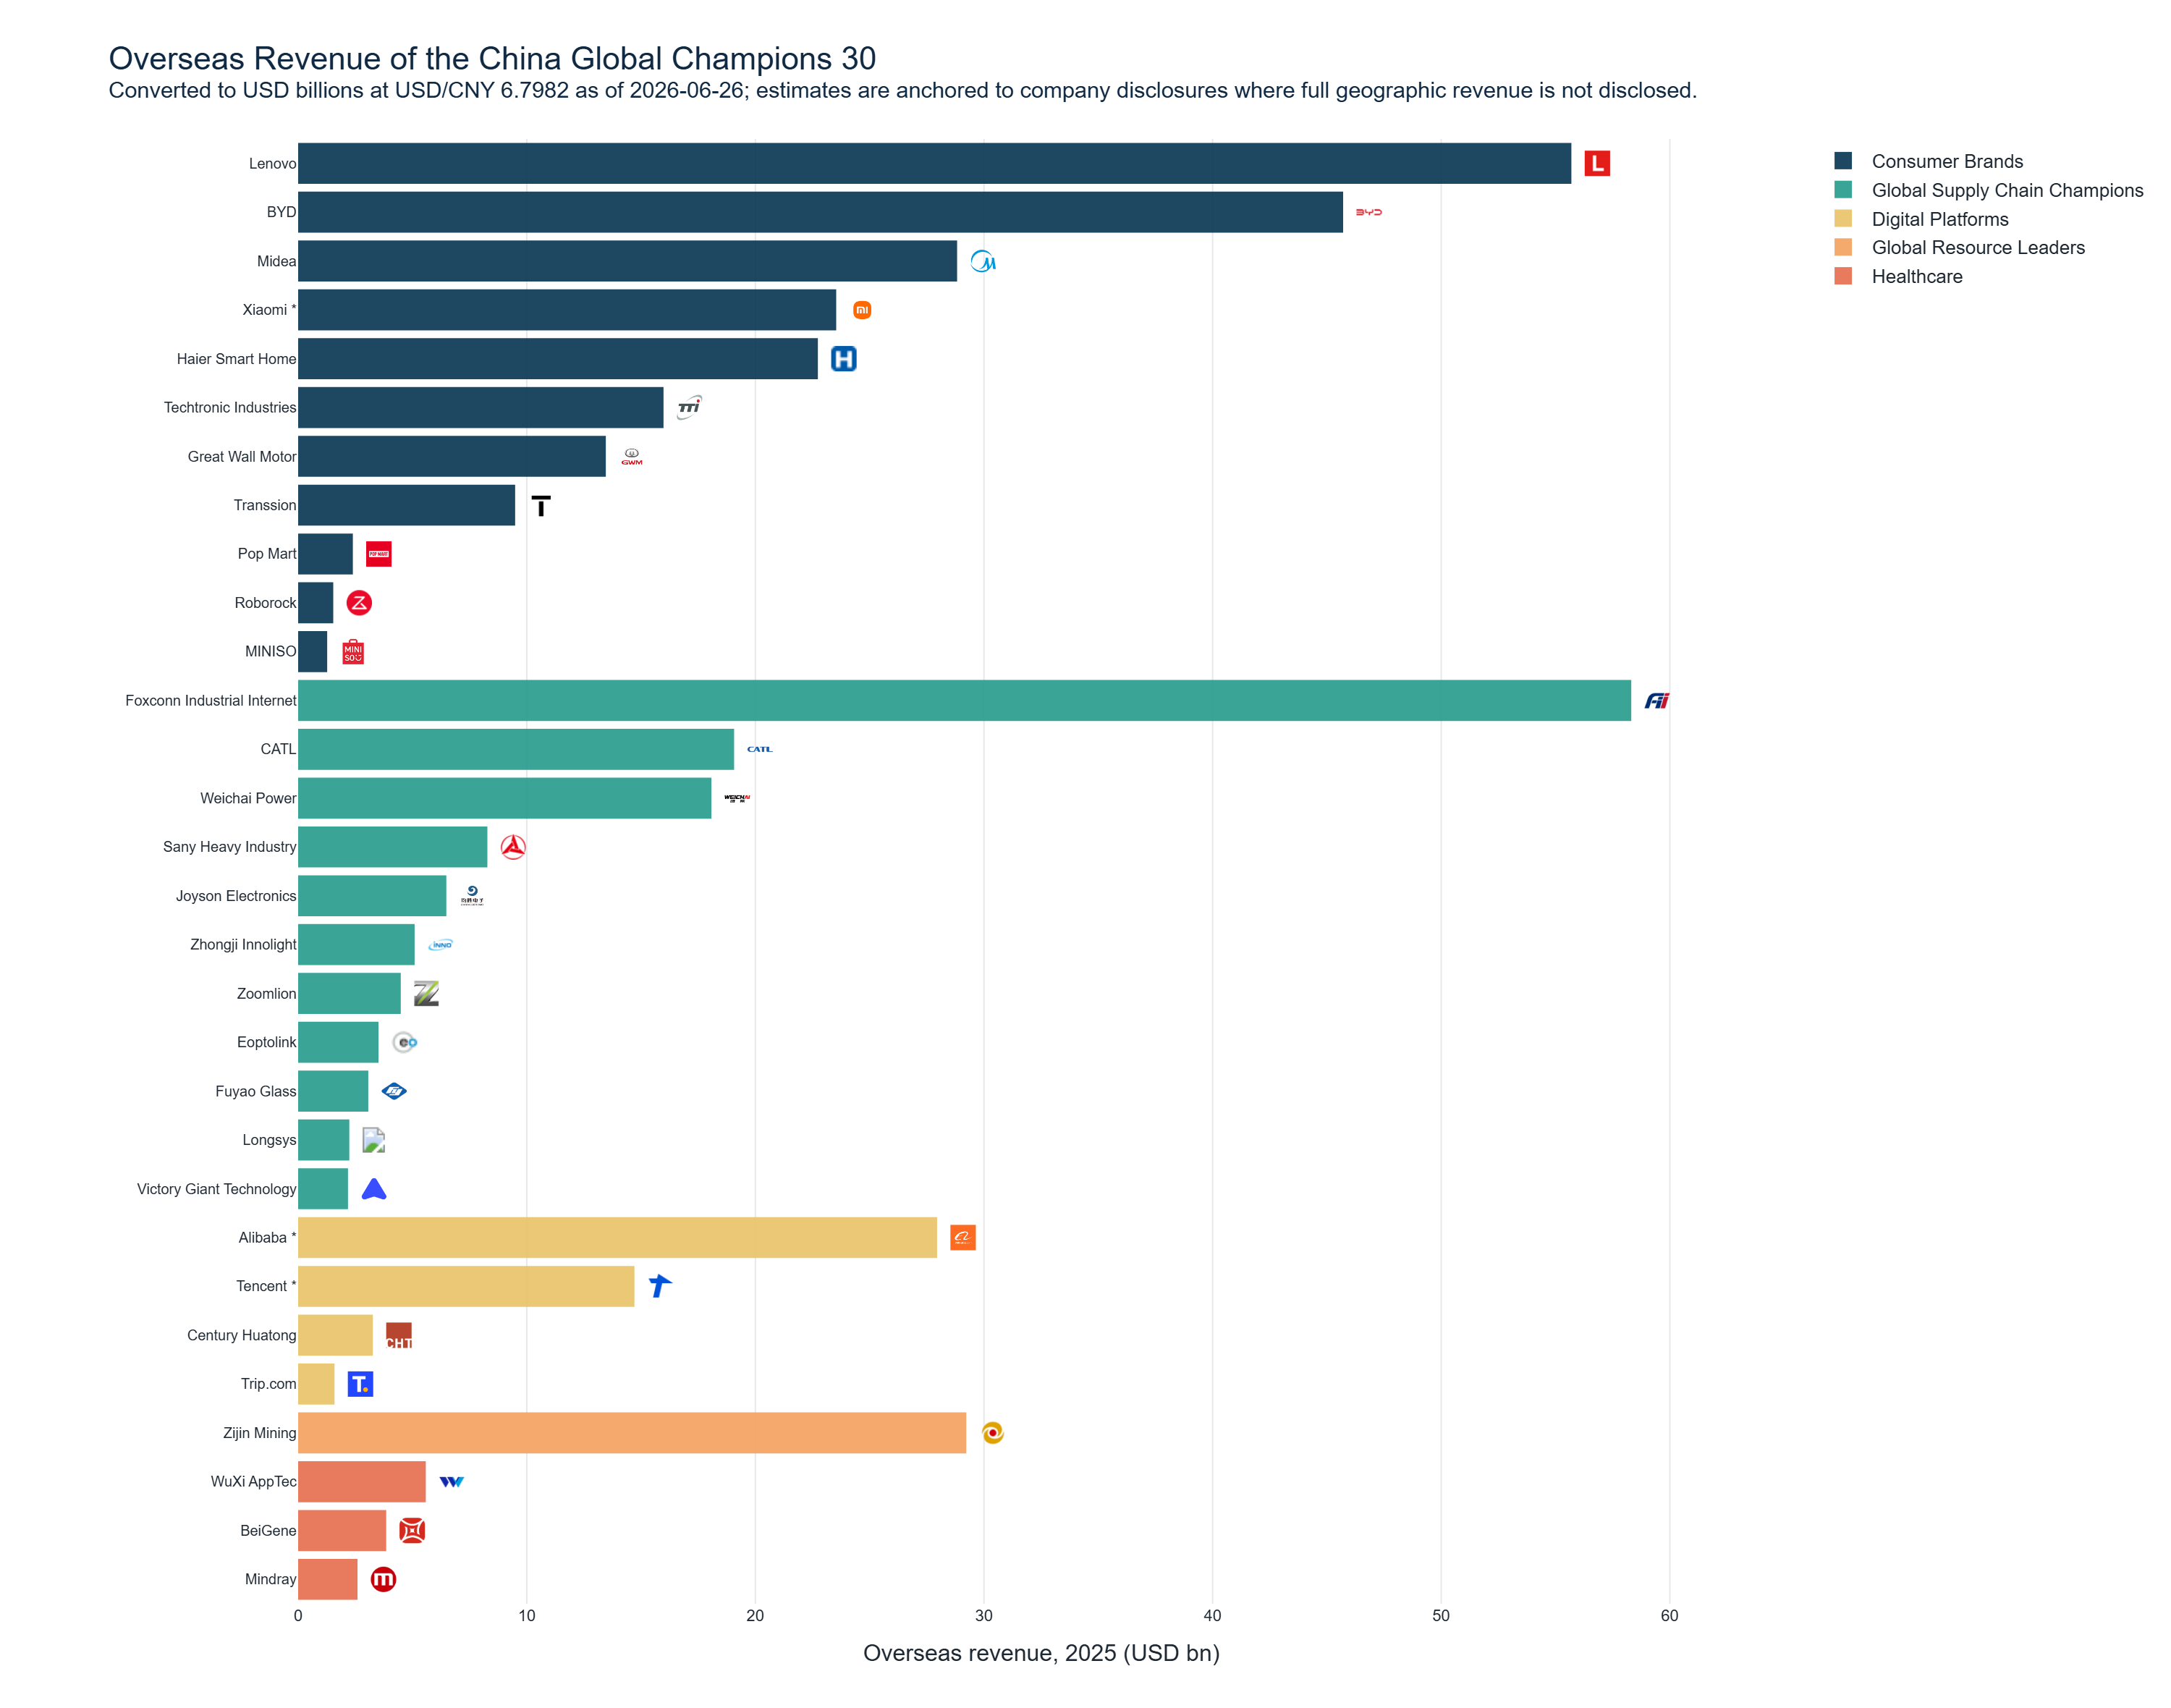
China Global Champions 30
What Did We Find?
The result was more interesting than we expected.
The 30 companies fall into five broad groups: Consumer Brands, Global Supply Chain Champions, Digital Platforms, Global Resource Leaders, and Healthcare. Representative Chinese names include Lenovo or BYD in Consumer Brands, CATL and Zhongji Innolight in Global Supply Chain Champions, Tencent or Alibaba in Digital Platforms, Zijin Mining in Global Resource Leaders and BeiGene or WuXi AppTec in Healthcare.
Taken together, the China Global Champions 30 generated about RMB 7.2 trillion in total revenue in 2025, or roughly USD 1.06 trillion. Their overseas revenue was about RMB 3.0 trillion, or roughly USD 440 billion, equal to around 41.5% of combined revenue on a weighted basis. The average company in the group had a much higher overseas exposure, about 56.5%, because several smaller champions are almost entirely overseas-facing. Profit quality is mixed but not low: the simple-average gross margin was about 37.6%, with a median of about 31.6%. The full company list and short business descriptions are included in the appendix.
For readers who prefer familiar global analogues, the five groups roughly rhyme with Coca-Cola, TSMC, Google, BHP and Pfizer.
As many would expect, Consumer Brands are the largest category by both overseas revenue and number of companies.
Many of these consumer names started as functional brands: Lenovo in PCs, BYD and Great Wall Motor in autos, Midea and Haier Smart Home in appliances, Xiaomi and Transsion in phones and smart devices, Techtronic Industries in power tools, and Roborock in home robotics. They compete on engineering, reliability and value for money, but some are no longer only about “good enough at a lower price.” They are beginning to develop tone, aesthetics and brand appeal of their own. We also see the rise of newer, more playful and curiosity-driven retail brands such as Pop Mart and MINISO, where store experience, IP, design language and social sharing matter almost as much as manufacturing efficiency.
What is more surprising is the second-largest group. It is not Digital Platforms, the category that contains Alibaba and Tencent. It is Global Supply Chain Champions.
FIGURE 3
Category Revenue Mix
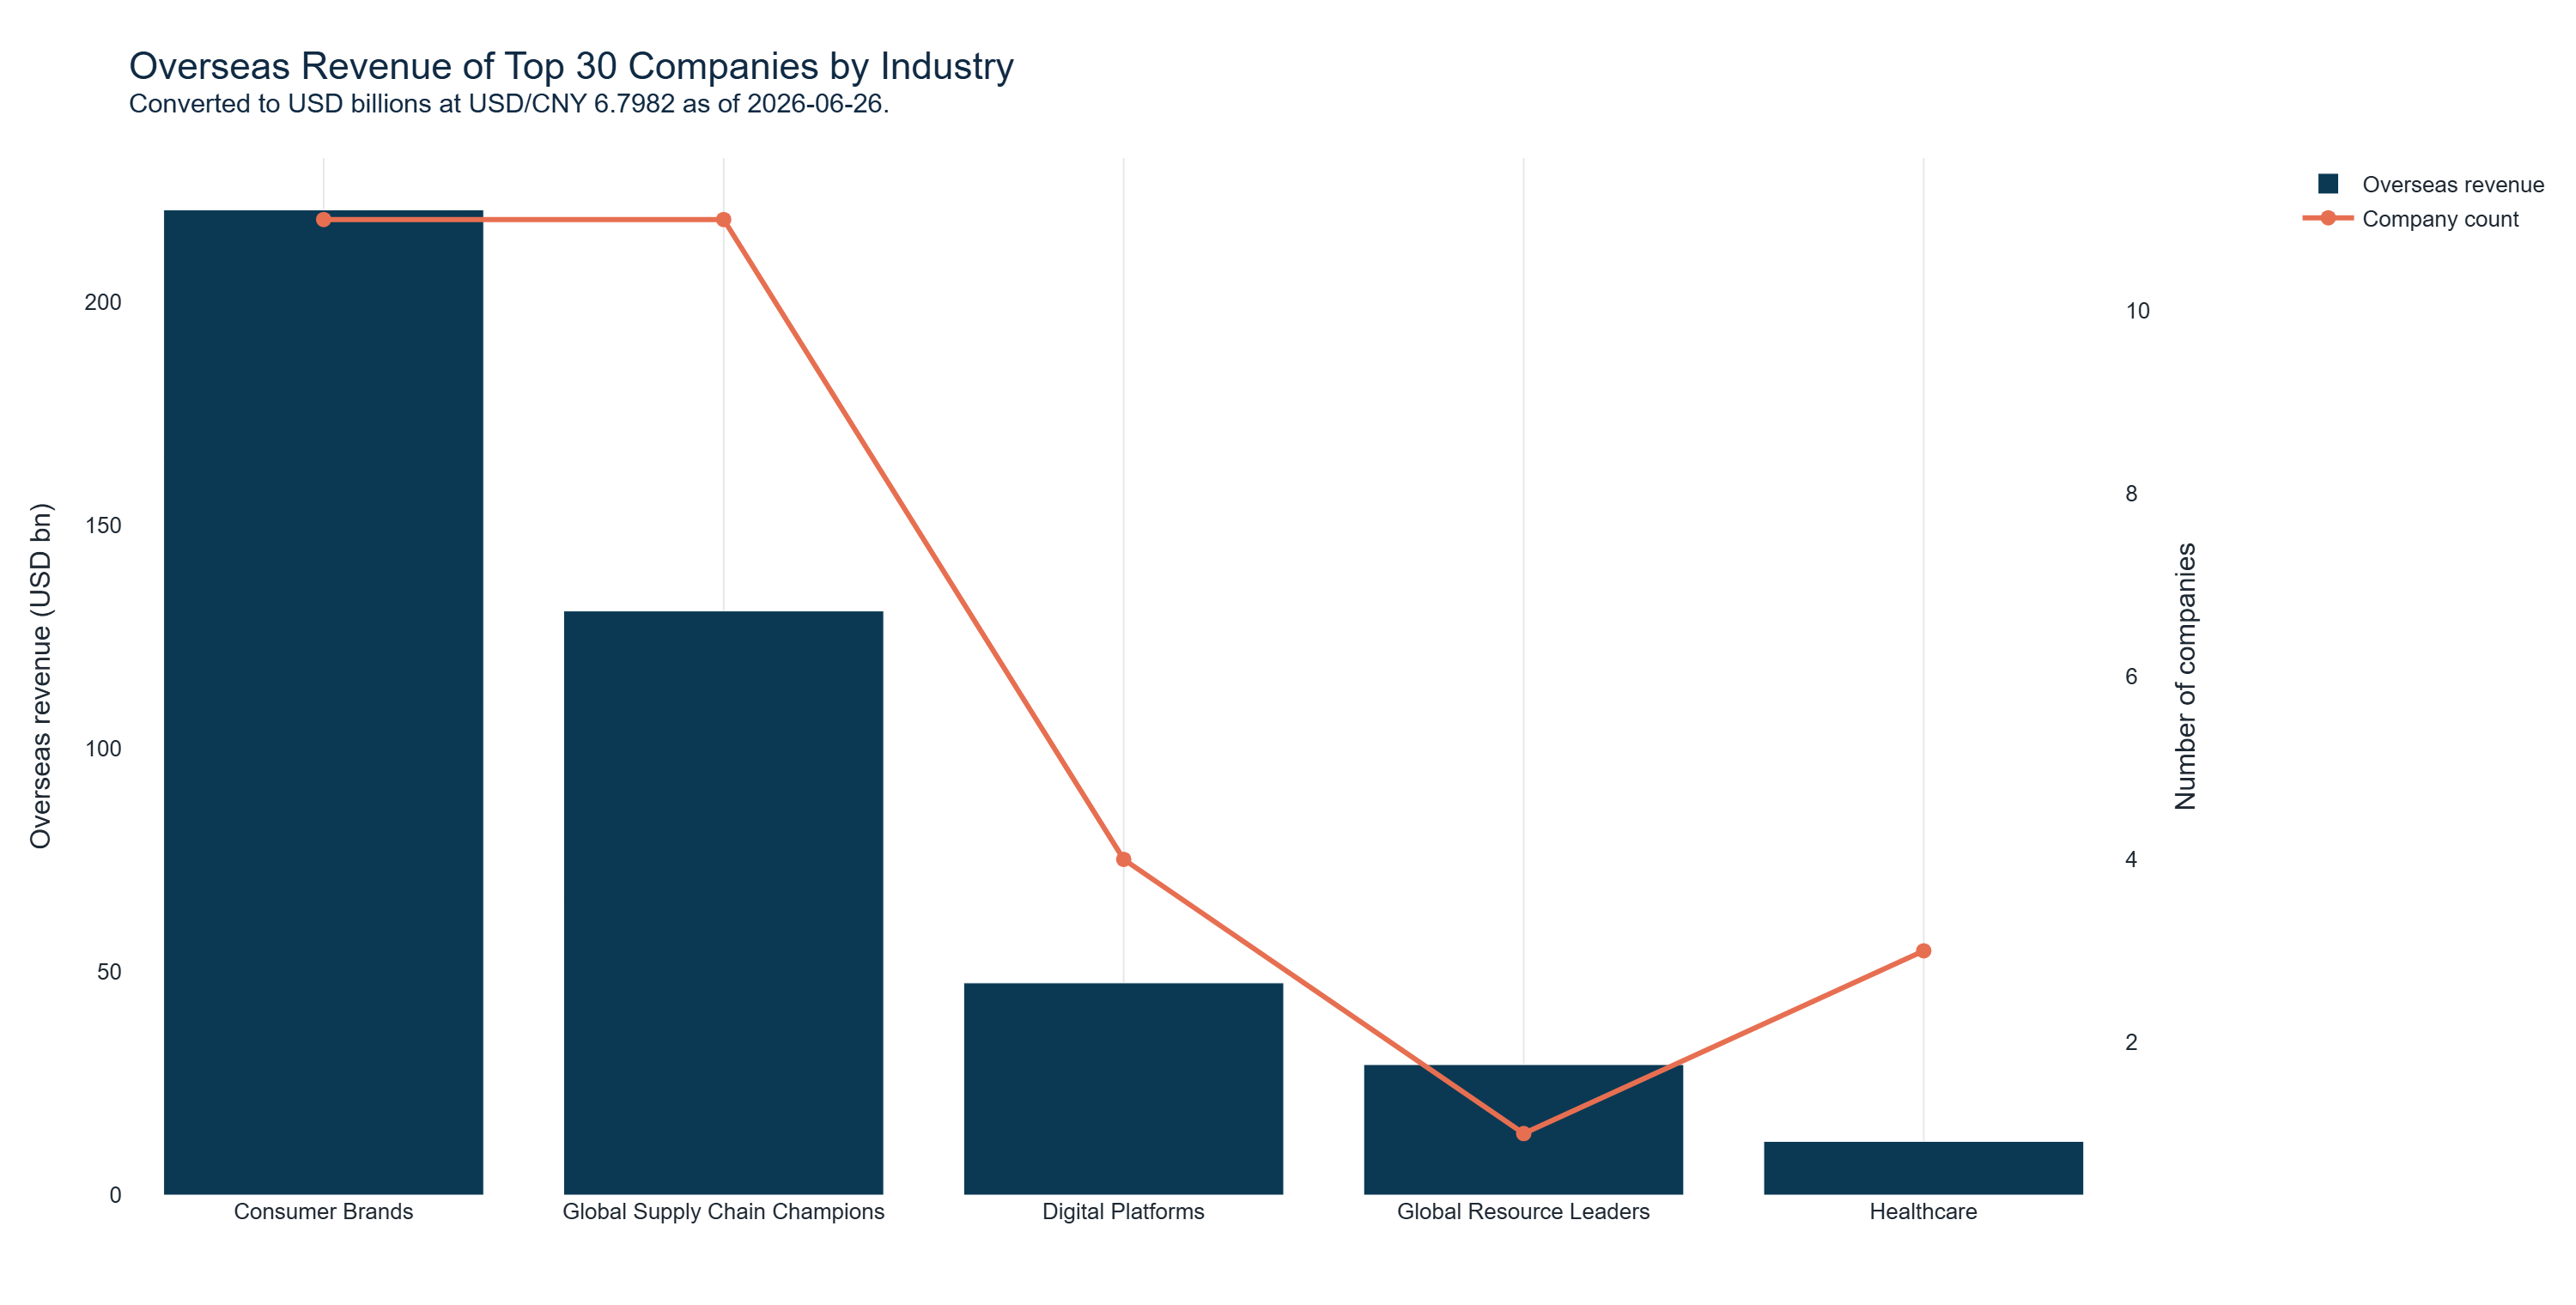
FIGURE 4
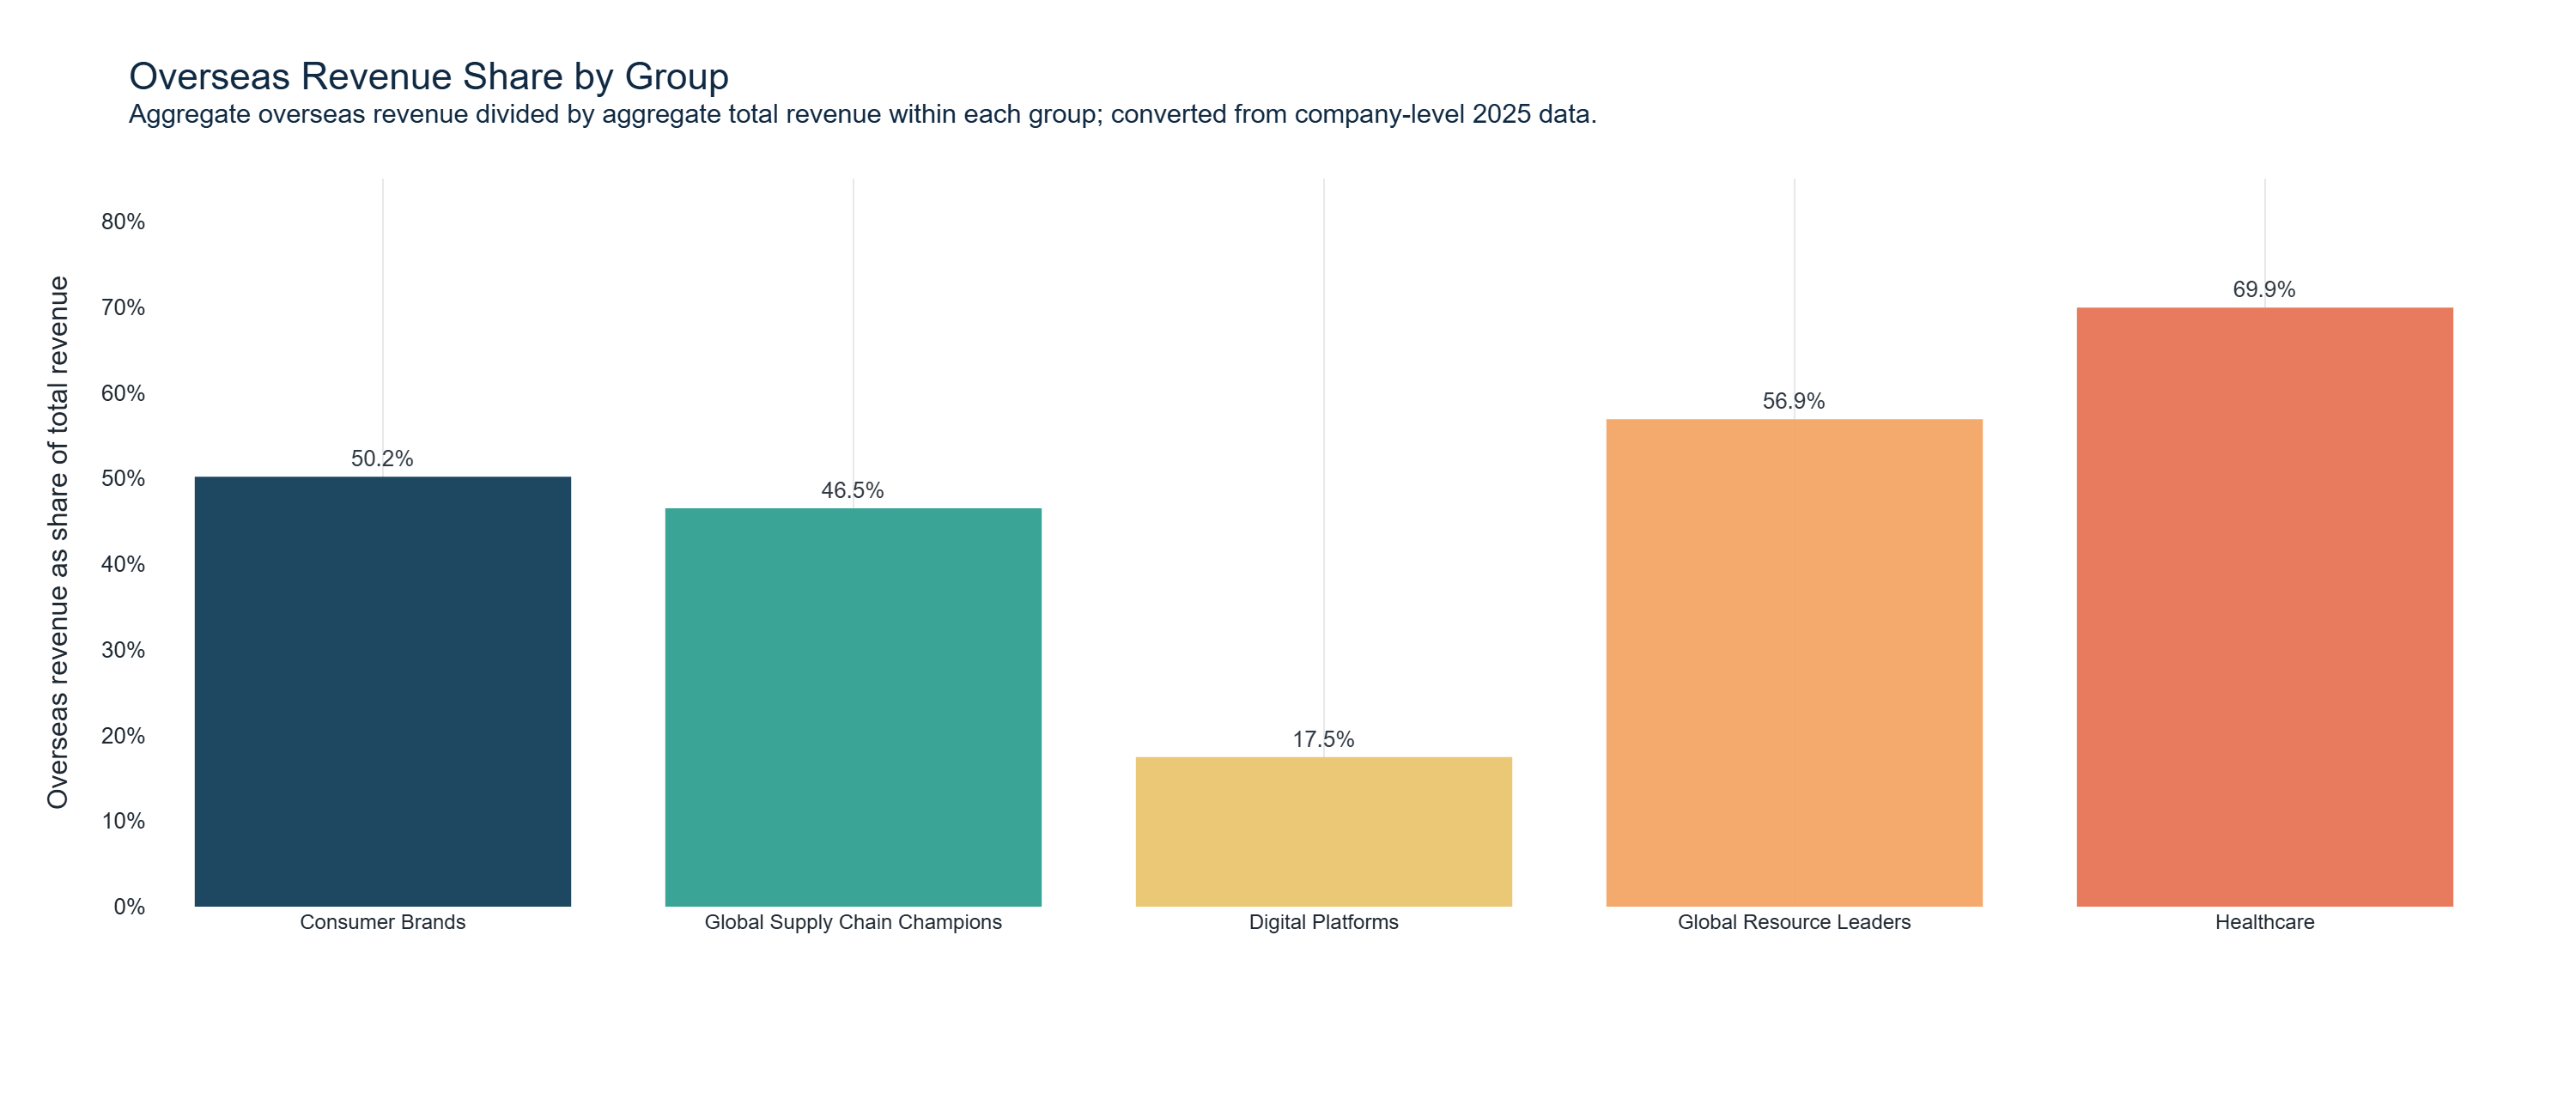
Overseas Revenue Share by Group
This fits the actual structure of China’s global rise. The country’s deepest advantage is still industrial: manufacturing depth, supplier density, engineering iteration and the ability to scale complex production quickly. The renewable-energy cycle created global leaders such as CATL and BYD (BYD also supplies batteries and automated manufacturing). The AI cycle is creating another cohort, from optical modules to PCB suppliers.
FIGURE 5
Overseas Revenue and Growth by Group
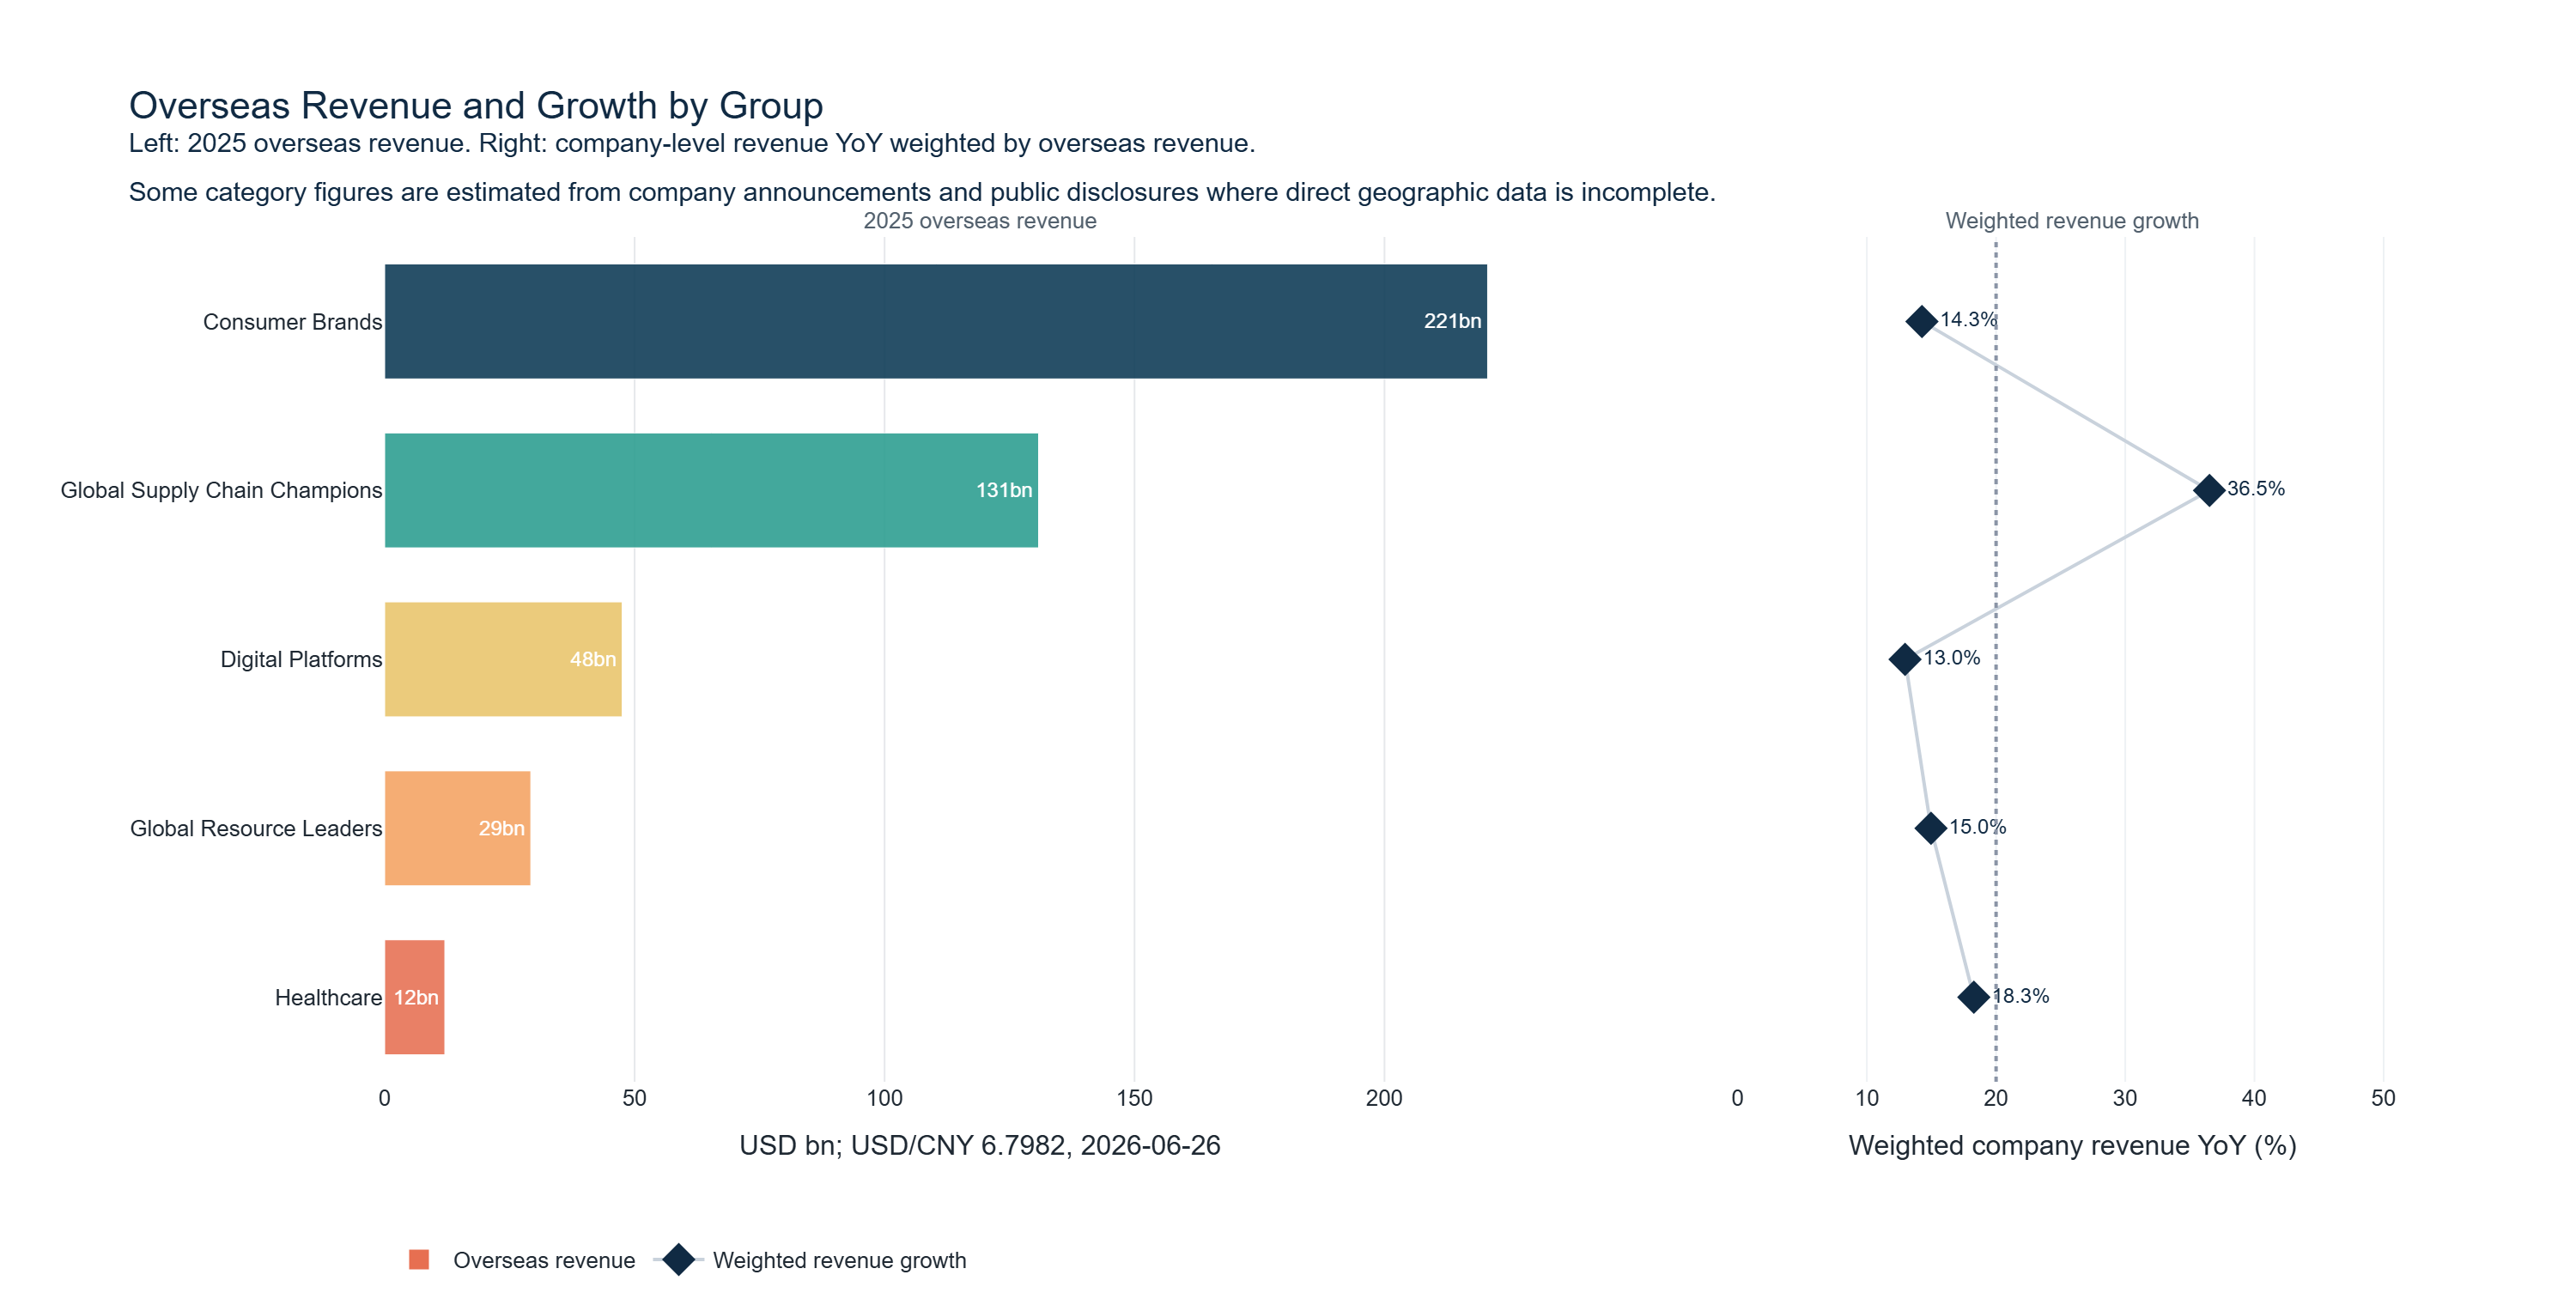
The supply-chain group looks much more dynamic than the names suggest. Its overseas revenue base is already large, and its growth rate is being pulled higher by AI hardware names such as Zhongji Innolight, Eoptolink, Longsys, Victory Giant Technology and Foxconn Industrial Internet. In other words, China did not miss the AI supply-chain boom. In some parts of it, Chinese companies are now more deeply embedded in the global AI capital-expenditure cycle than they were in previous technology cycles.
Digital Platforms come third. They still have high margins and powerful business models, but their international expansion is slower and more constrained. Regulation, localization, geopolitics and platform-specific policy risks all matter. The Great Firewall helped shield China’s internet companies from Western platform giants at home, but it also slowed the overseas expansion of Chinese internet companies. The result is a sharp contrast with the global brand-value distribution, where the most valuable brands are overwhelmingly digital-platform-led.
FIGURE 6
Kantar BrandZ Global Top 20 Brand Value Mix
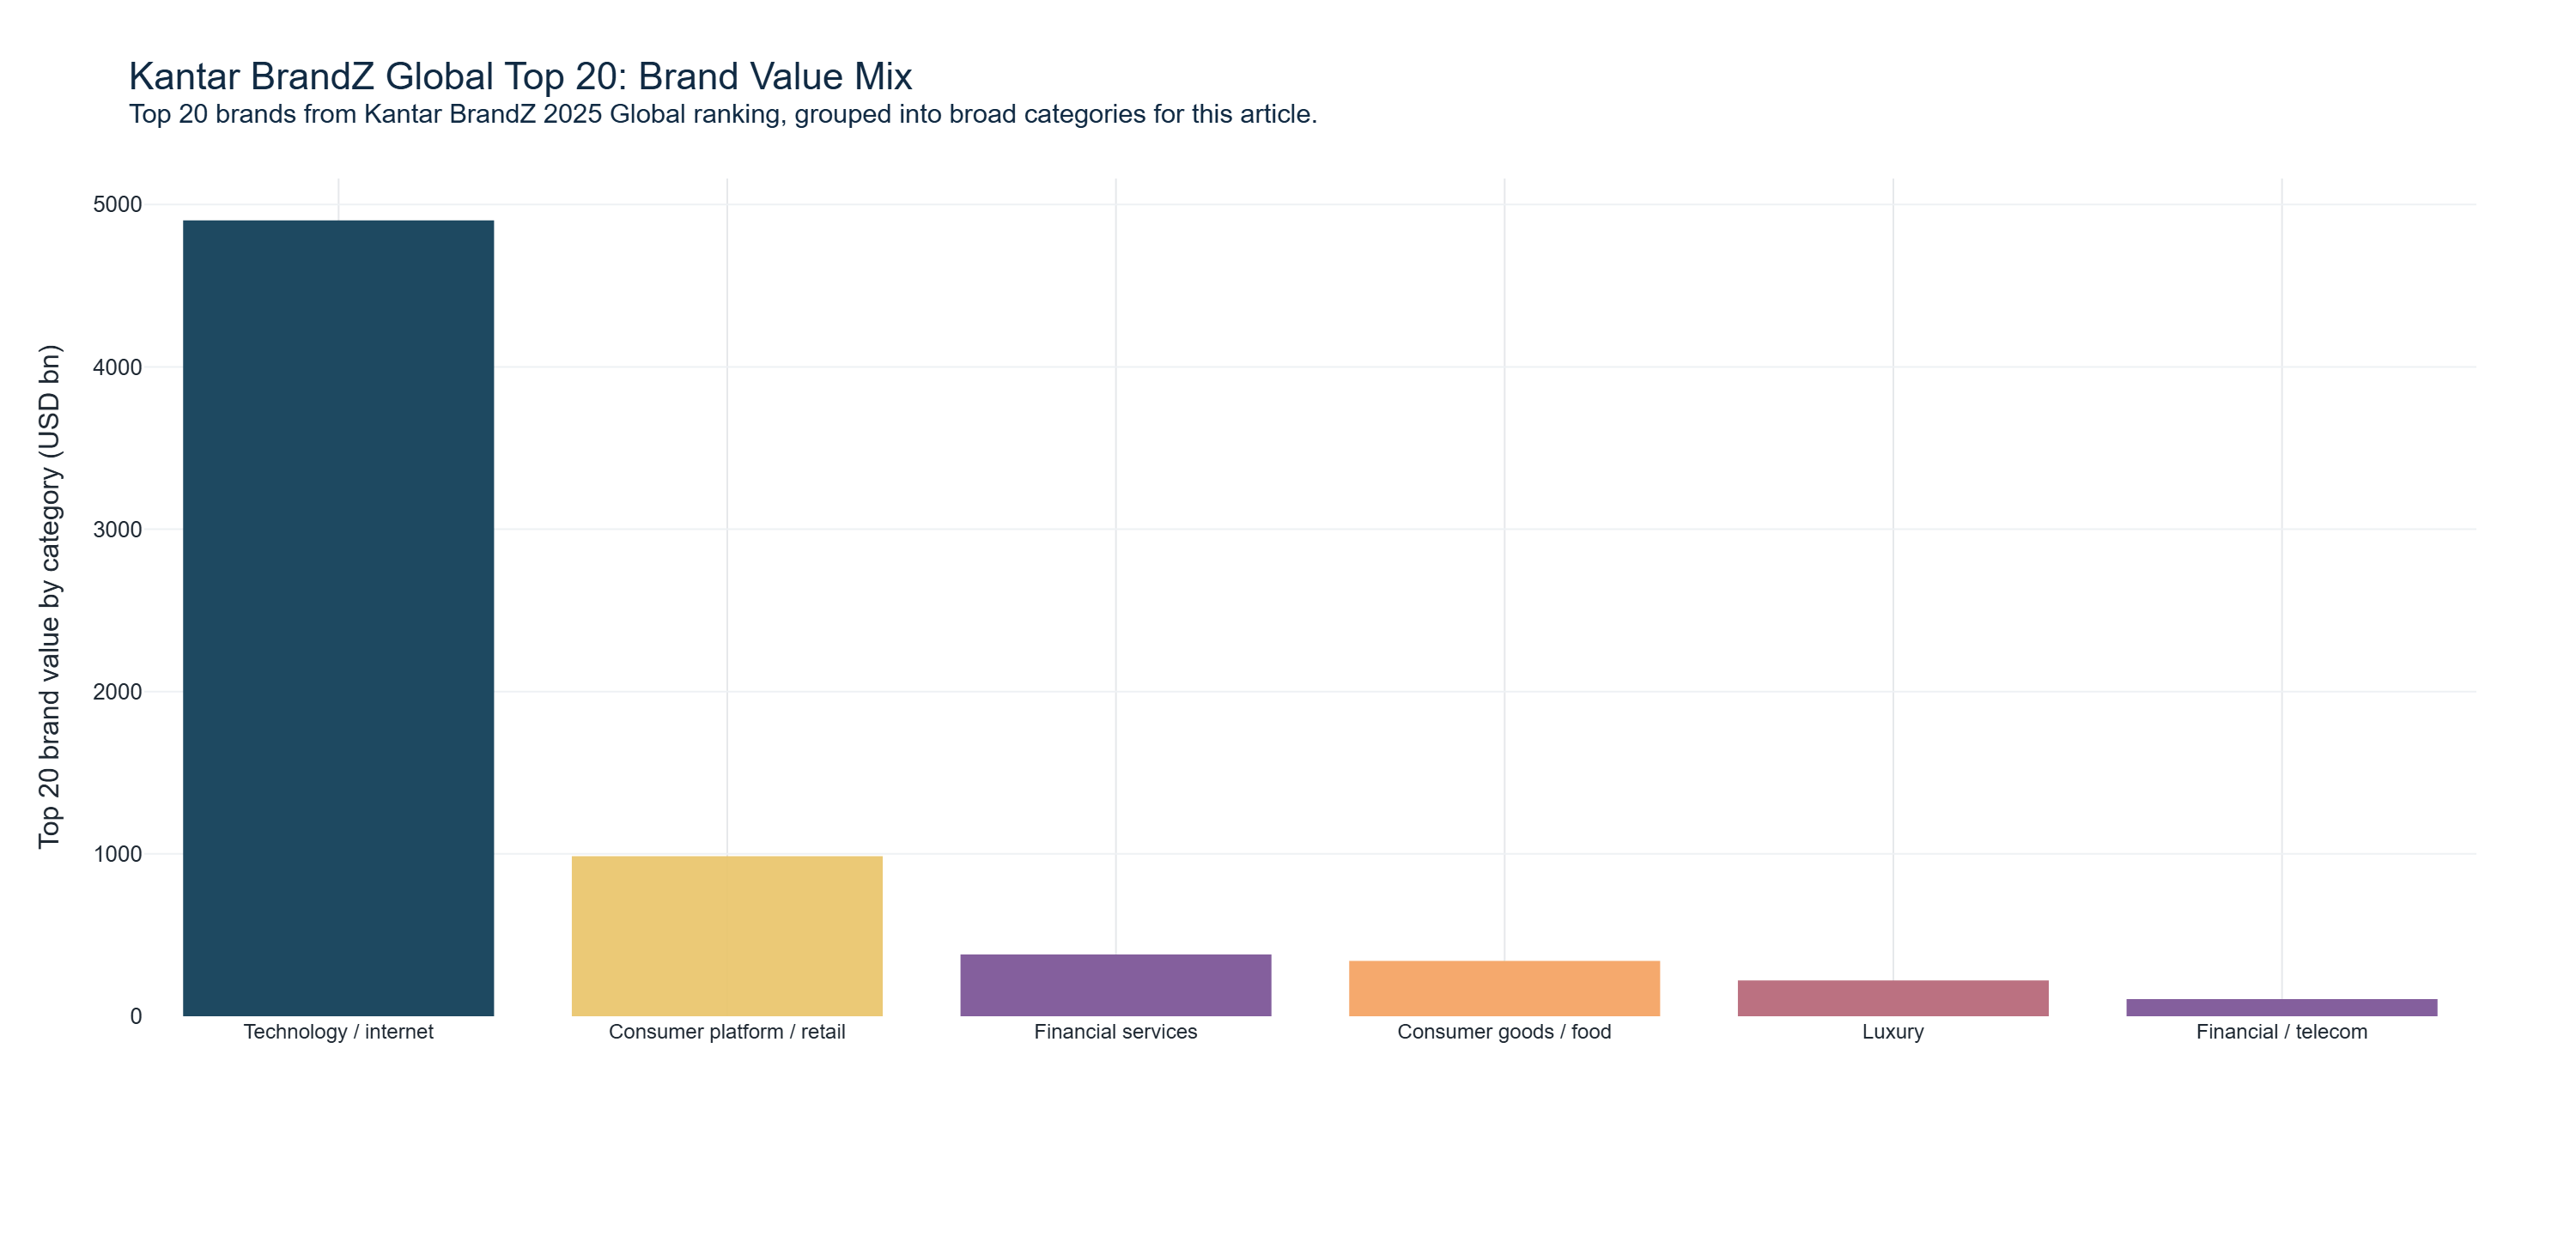
Global Resource Leaders and Healthcare remain smaller in this screen. That does not mean they are unimportant. It means their listed-company overseas revenue base is still less fully scaled than the consumer and industrial supply-chain groups. For Healthcare in particular, the road is long: Chinese companies are beginning to prove themselves through innovative drugs, medical devices and CXO services, but the category has not yet reached the scale of global pharmaceutical leaders.
The Top 30 therefore captures a distinctly Chinese pattern of globalization. Consumer-facing companies are important, but they are not always the brands non-Chinese readers know best. Many reach end consumers first through ODM/OEM relationships. Others acquire local brands to access overseas markets, while some are still building localized distribution networks of their own, as BYD is doing in autos. Meanwhile, the supply-chain companies often matter more than their brand visibility suggests. They do not always own the end-consumer relationship, but they own a critical position inside the global production system.
This is also why a straight comparison between China and the U.S. has to be made carefully, if any of you are interested. In the U.S., the public faces of global expansion are now a group of technology giants, digital platforms, and a few consumer-brand giants. In China, the global story is much more manufacturing-heavy.
There is another reason not to compare companies too mechanically. The U.S. domestic market is itself enormous, and it is one of the most important destination markets for many Chinese companies going global. Excluding the home market from U.S. companies can therefore create a distorted comparison. Many U.S. companies also have decades of global operating history. For Chinese companies, this cycle is still much earlier.
FIGURE 7
China Versus U.S. Manufacturing Share
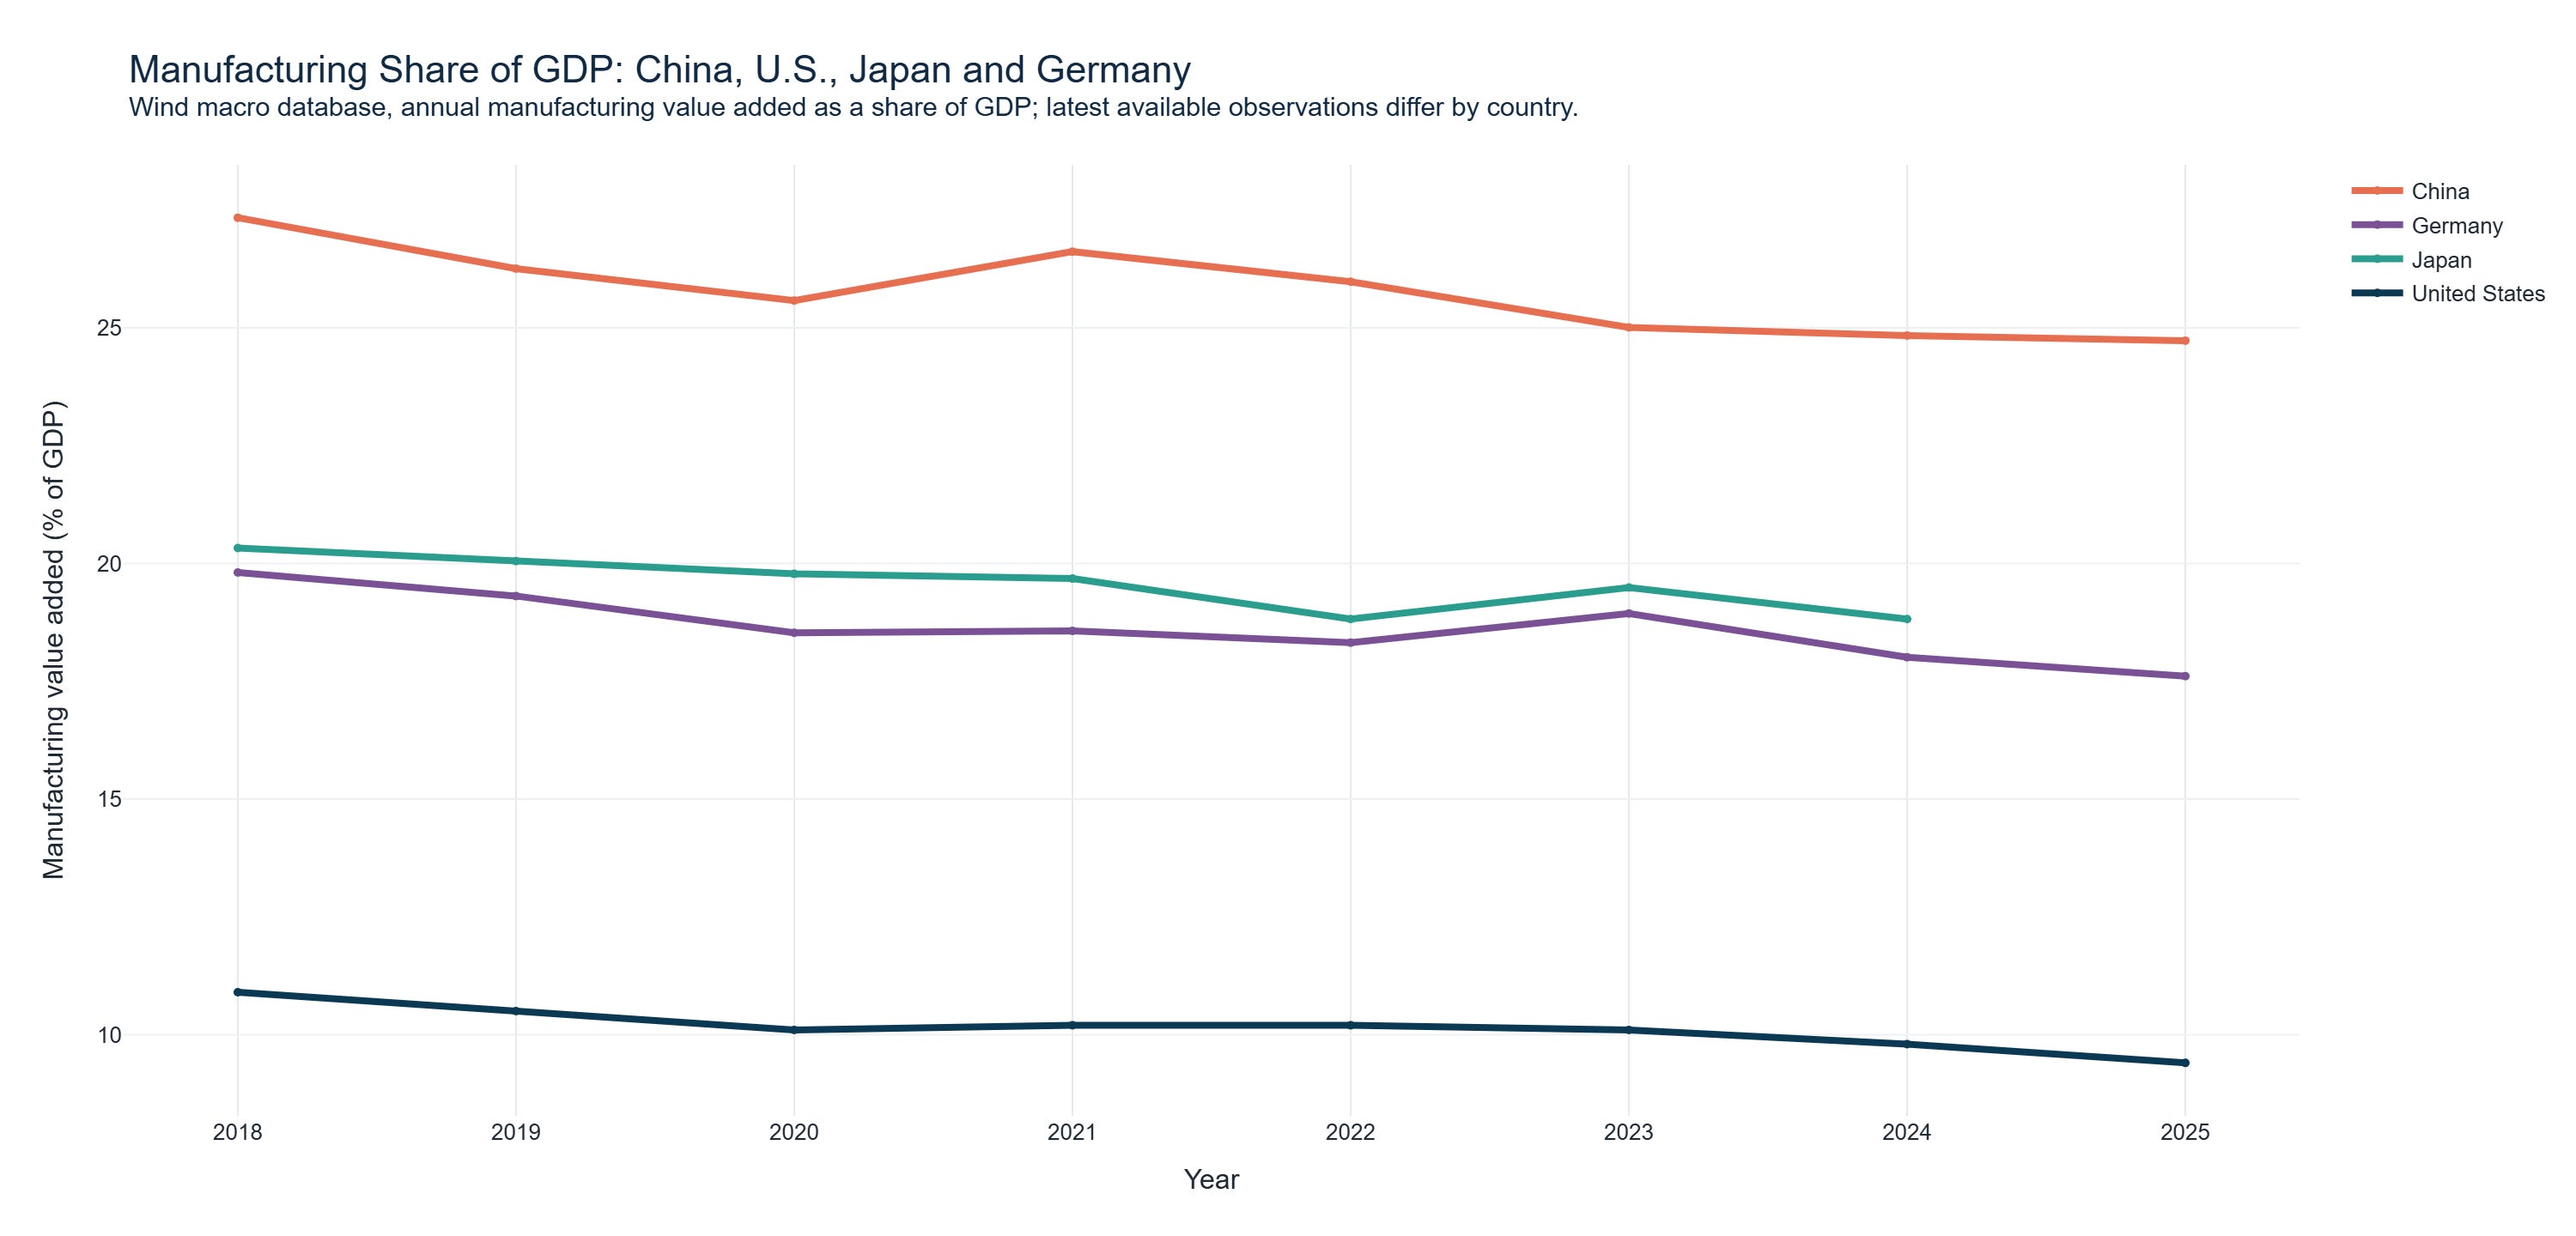
So much for the fundamentals. In future parts of this series, we will go deeper into company fundamentals, compare China’s current going-global cycle with Japan’s earlier overseas expansion, and test different screening rules for a more growth-oriented China global basket. For now, what happens when we look at the stock market?
Here the picture changes completely.
At first glance, the equal-weight China Global Champions 30 index looks excellent. From early 2025 to June 26, 2026, it rose about 90.8%, far ahead of broad China benchmarks. That would seem to validate the theme.
FIGURE 8
Top-30 Equal-Weight Stock Index
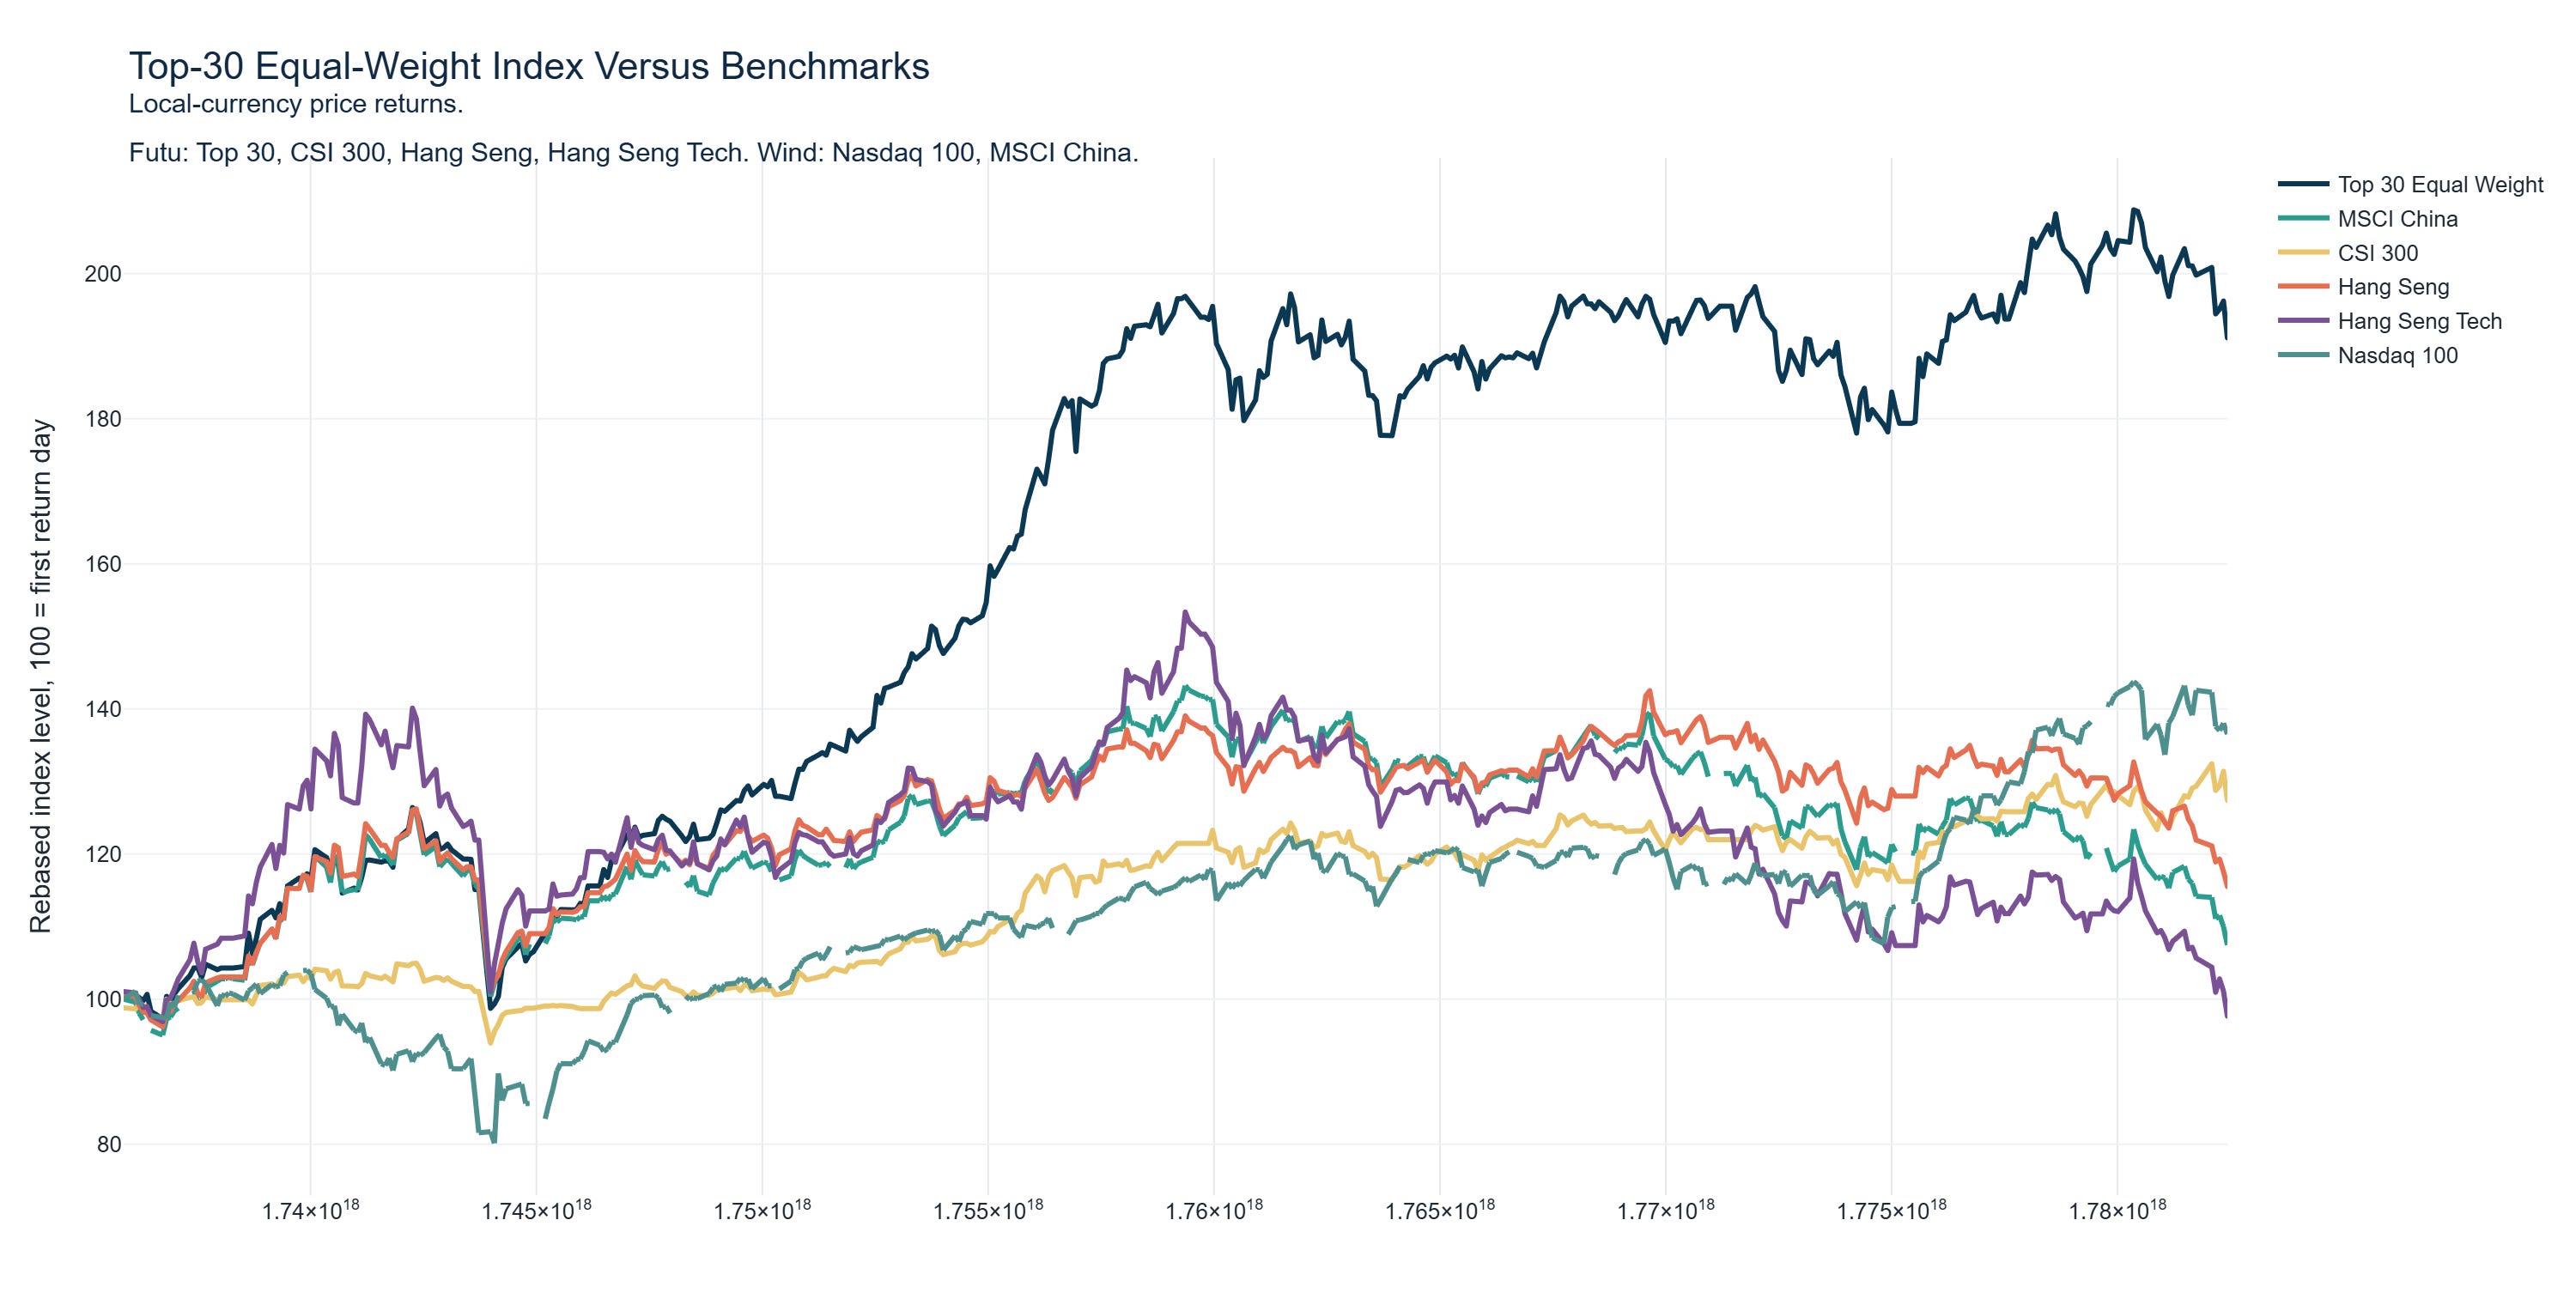
But once we break it apart, the story is much less broad-based. The Supply Chain sub-index rose about 323.7%, while Consumer Brands were almost flat, up only about 1.2%. Digital Platforms and Resources had large drawdowns. The winners were concentrated in a narrow cluster of AI hardware and electronics names. Zhongji Innolight, Eoptolink, Longsys and Victory Giant Technology carried much of the performance burden, while many consumer and healthcare names delivered mediocre or negative stock returns.