China's Real Estate Market Post-Liberation Day - Charts of the Week
Holding Steady or Heading for Trouble?
"Charts of the Week" is Baiguan's series that features key data points to help you quickly grasp the general state of affairs in China in just a few minutes. We handpick the highlights of the data charts from a variety of sources, analyzing and delivering insights trusted by 100+ top institutional and corporate clients worldwide at BigOne Lab. Don't forget to subscribe before you continue reading!
China's real estate sector is one of the most critical components of its economic fabric, directly influencing consumer confidence and broader economic stability. The past few months have shown a mixed bag of trends, especially following the "Liberation Day".
In this edition of the "Charts of the Week" series, I've selected a few key charts from the latest existing home sales data across 90+ Chinese cities. We'll explore questions such as how China's real estate market is holding up year-to-date, with a particular focus on export-reliant cities, and examine whether they have been affected post "Liberation Day".
Data sourced from BigOne Lab, the parent company of Baiguan Newsletter. I cover the latest data up to May 10, which should provide a timely understanding of how China's real estate market is responding after Liberation Day.
*Note: For this newsletter: Six cities were selected as export-reliant cities: Shenzhen, Ningbo, Xiamen, Jinhua, Suzhou, and Dongguan. These cities have more than 50% of their GDP reliant on exports [*].
2025 Year-to-Date: Holding Strong
Despite ongoing deflationary pressures and external challenges, the Chinese real estate market remains relatively stable. There are signs of recovery in key urban centers, with significant increases in listing volumes as well as property viewings, especially in first-tier and new first-tier cities, even after Liberation Day.
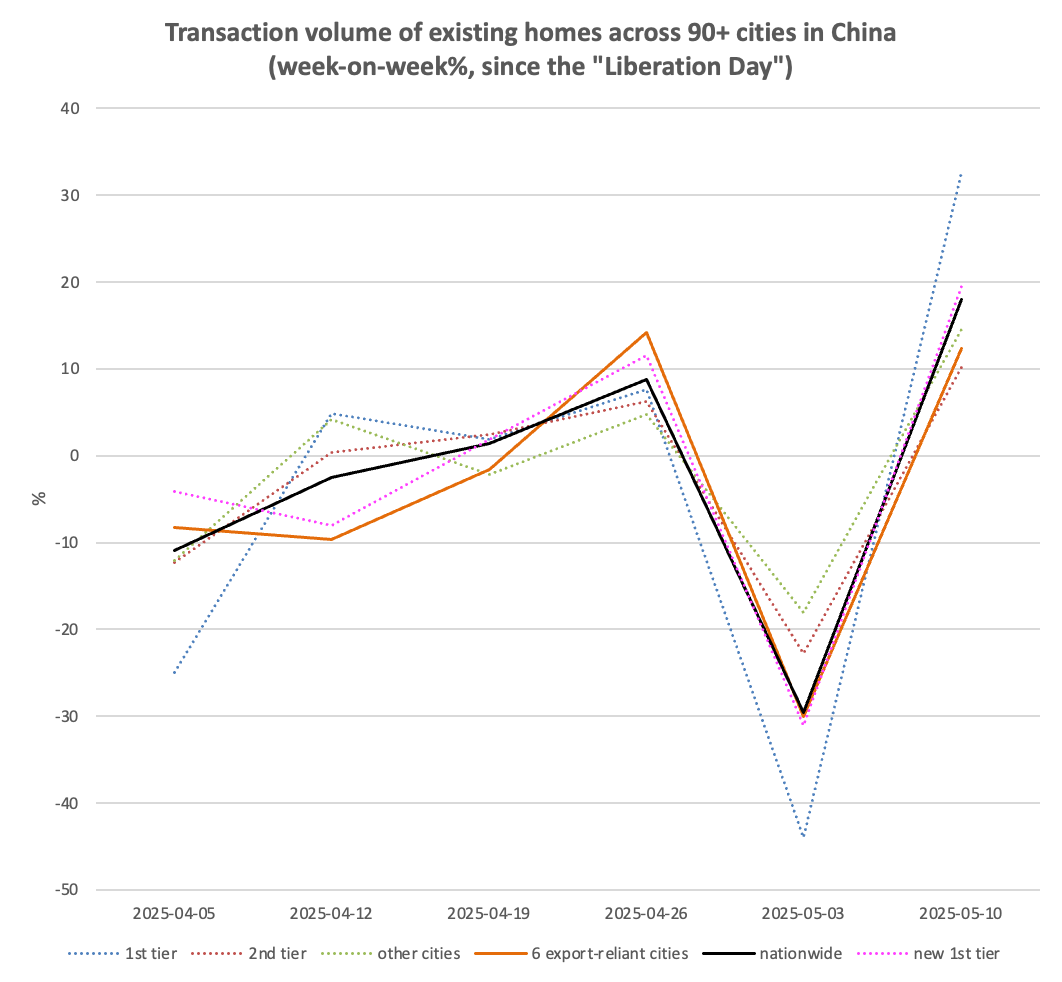
In week 19 of 2025 (May 4–10), transaction volumes for existing homes in over 90 cities rose 23% year-over-year (YoY) and 18% week-over-week (WoW). Specifically, transaction volumes in first-tier, new first-tier, and second-tier cities (these are China's metropolises and regional centers) grew by 31%, 18%, and 28% YoY, respectively, and by 33%, 19%, and 10% WoW.
Although this week’s transaction data shows a significant drop compared to the weekly average of the previous two months, the YoY growth remains positive, with the pace of growth almost the same as the prior months—particularly in first-tier cities, where YoY growth has expanded further.
Keep reading to discover the latest trends in property viewing (a key indicator of homebuying intentions), how export-reliant cities have been affected and how the listing-to-transaction ratio has evolved.
To get a sense of what is offered, you are welcome to check out this older post in the same series: Charts of the Week. You can also get free access by sharing us. For more timely discussions, consider joining our private Discord channel for paid readers.


