

China re-inflation? - Charts of the Week
CPI turns positive, but real estate and retail data show the "sugar high" of October is fading.

“Charts of the Week” is Baiguan’s series that features key data points to help you quickly grasp the general state of affairs in China in just a few minutes. We handpick the highlights of the data charts from a variety of sources, analyzing and delivering insights trusted by 100+ top institutional and corporate clients worldwide at BigOne Lab. Don’t forget to subscribe before you continue reading!
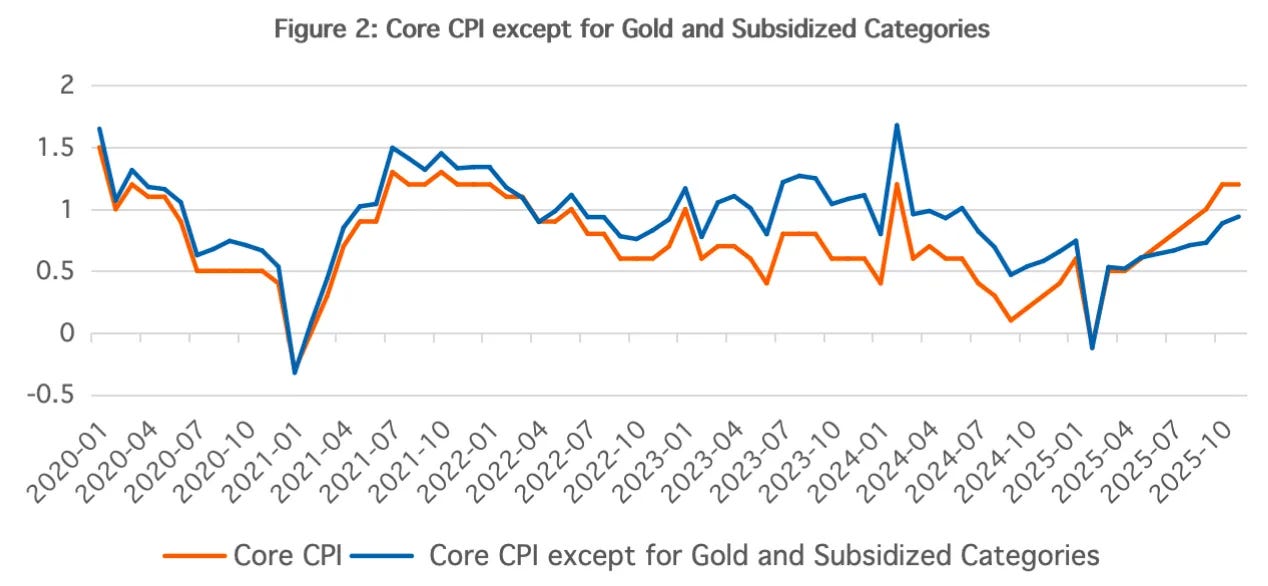
Recent macro data has sent mixed signals. On one hand, China’s CPI has turned positive for two consecutive months, sparking discussions on whether the economy is finally walking out of deflation. Although November’s headline CPI was primarily driven by an increase in vegetable and gold prices, the core CPI (excluding more volatile items, including food & energy) continues to trend upward.
Chart in highlight: After excluding goods related to trade-in programs and the gold category, the core CPI remains on an upward trend.
From our partner CF40 Research‘s latest takeaways from China’s November 2025 macroeconomic data. CF40 Research is a leading independent think tank in China focused on macroeconomic and financial policy.
This resilience is largely driven by services. As we noted previously, services are becoming the structural growth engine of China’s economy. Service consumption grew 5.4% year on year from January to November (which is above the 4% for total social retail sales).
In contrast, physical goods consumption remains weaker. Additionally, the “sugar high” from the National Day Golden Week in October appears to be fading. November data points to a cooldown: social retail sales growth slowed to 1.3% year on year, marking six consecutive months of deceleration. The broader consumption recovery is facing more challenges as government subsidies taper off.
Today, we look at high-frequency data across housing, dining, liquor, retail, luxury sales, and the job market to gauge the true temperature of the recovery as we head into the end of 2025.
Real Estate: The post-holiday cool-down
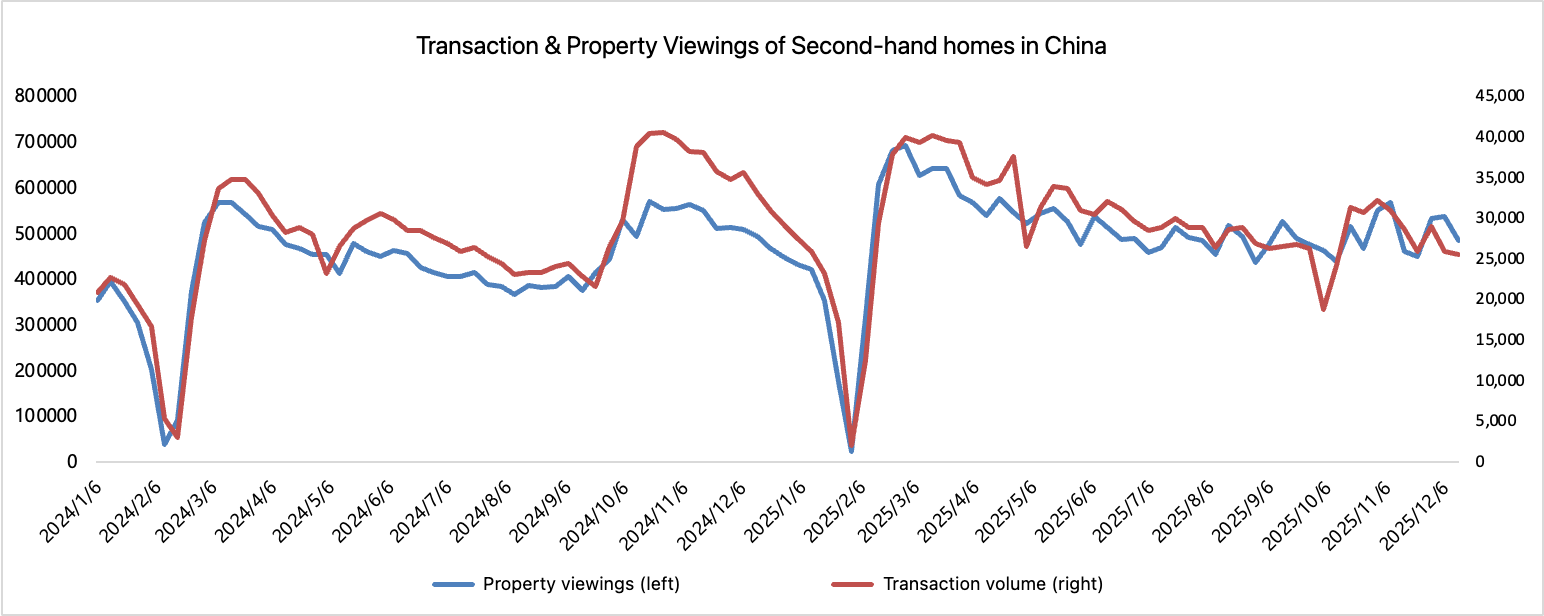
Key Takeaway: Transaction volumes and viewings continued to drop after the October peak.
In week 50 of 2025 (Dec 7–13), second-hand home transaction volumes across 90+ cities fell 20% year on year. Households remain in a wait-and-see mode, with no clear signs of a meaningful improvement in market confidence.
Across first-tier, new first-tier, and second-tier cities, viewing activity has turned negative across the board on both a month-on-month and year-on-year basis.
Dining
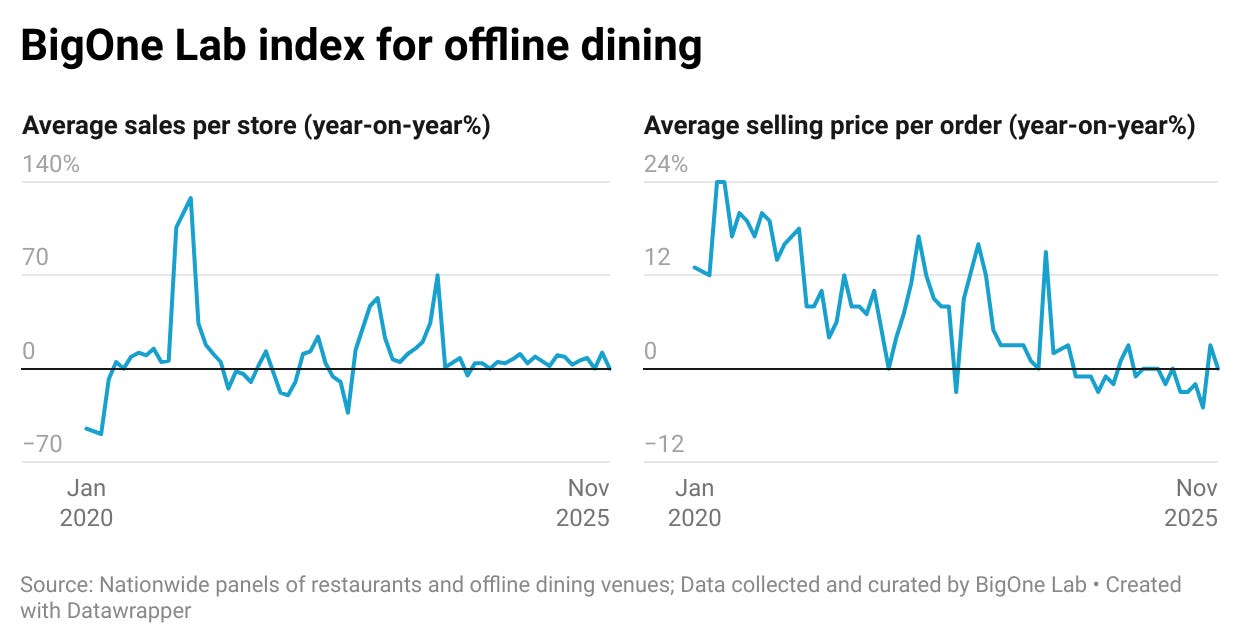
Key Takeaway: Consumers return to rational spending following the holiday splurge.
While October saw a spike in dining activity, November data from BigOne Lab’s offline dining index shows a rapid normalization. Notably, the average selling price (ASP) growth slowed significantly to just 0.4% year-on-year in November.
High-end Baijiu (white liquor), especially Moutai, is often viewed as a barometer for business activity and sentiment in China. Wholesale prices for major premium brands, including the bellwether Moutai 1935 and Wuliangye, have seen steep declines throughout the second half of 2025, reflecting weak business and banquet demand.
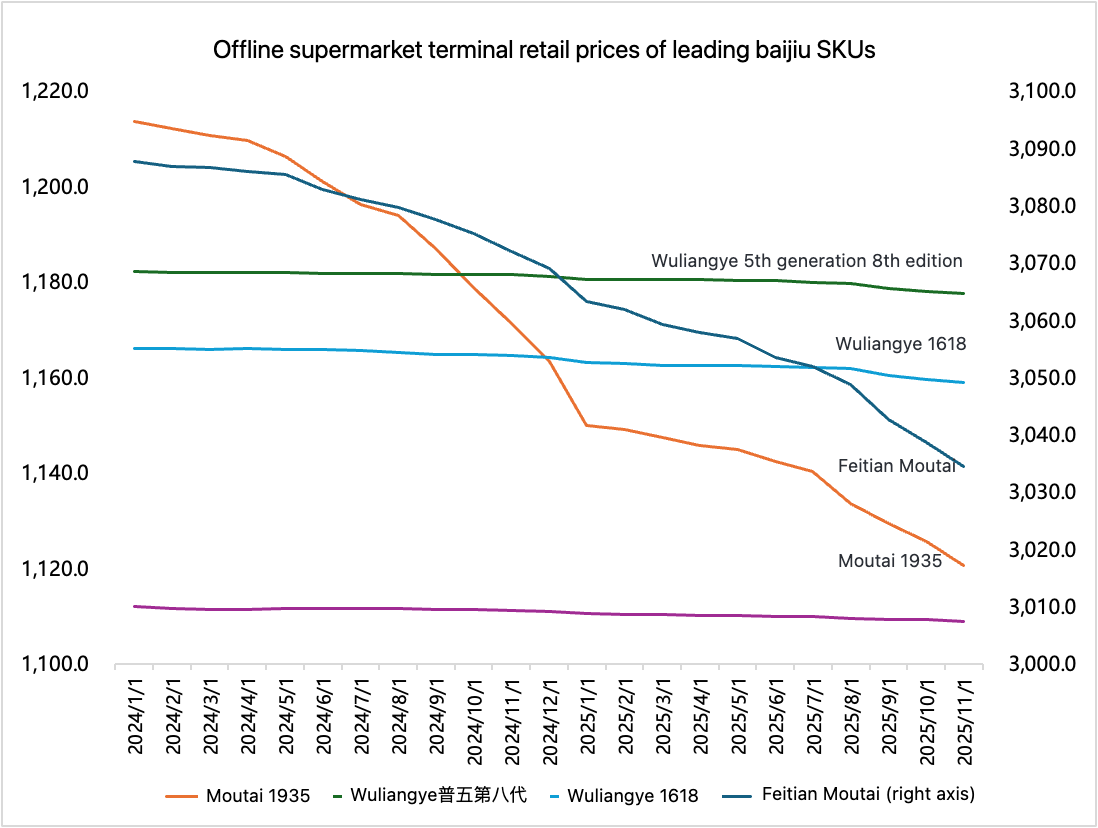
Correspondingly, the sales performance of major liquor companies (Moutai, Wuliangye, Luzhou Laojiao) in offline channels has also cooled down after the holiday season pick-up. Most recorded negative or slowing year-on-year growth in Q3, and moving into Q4.
Retail
Key Takeaway: Discretionary consumption is outperforming, while housing-related spending drags down the total.
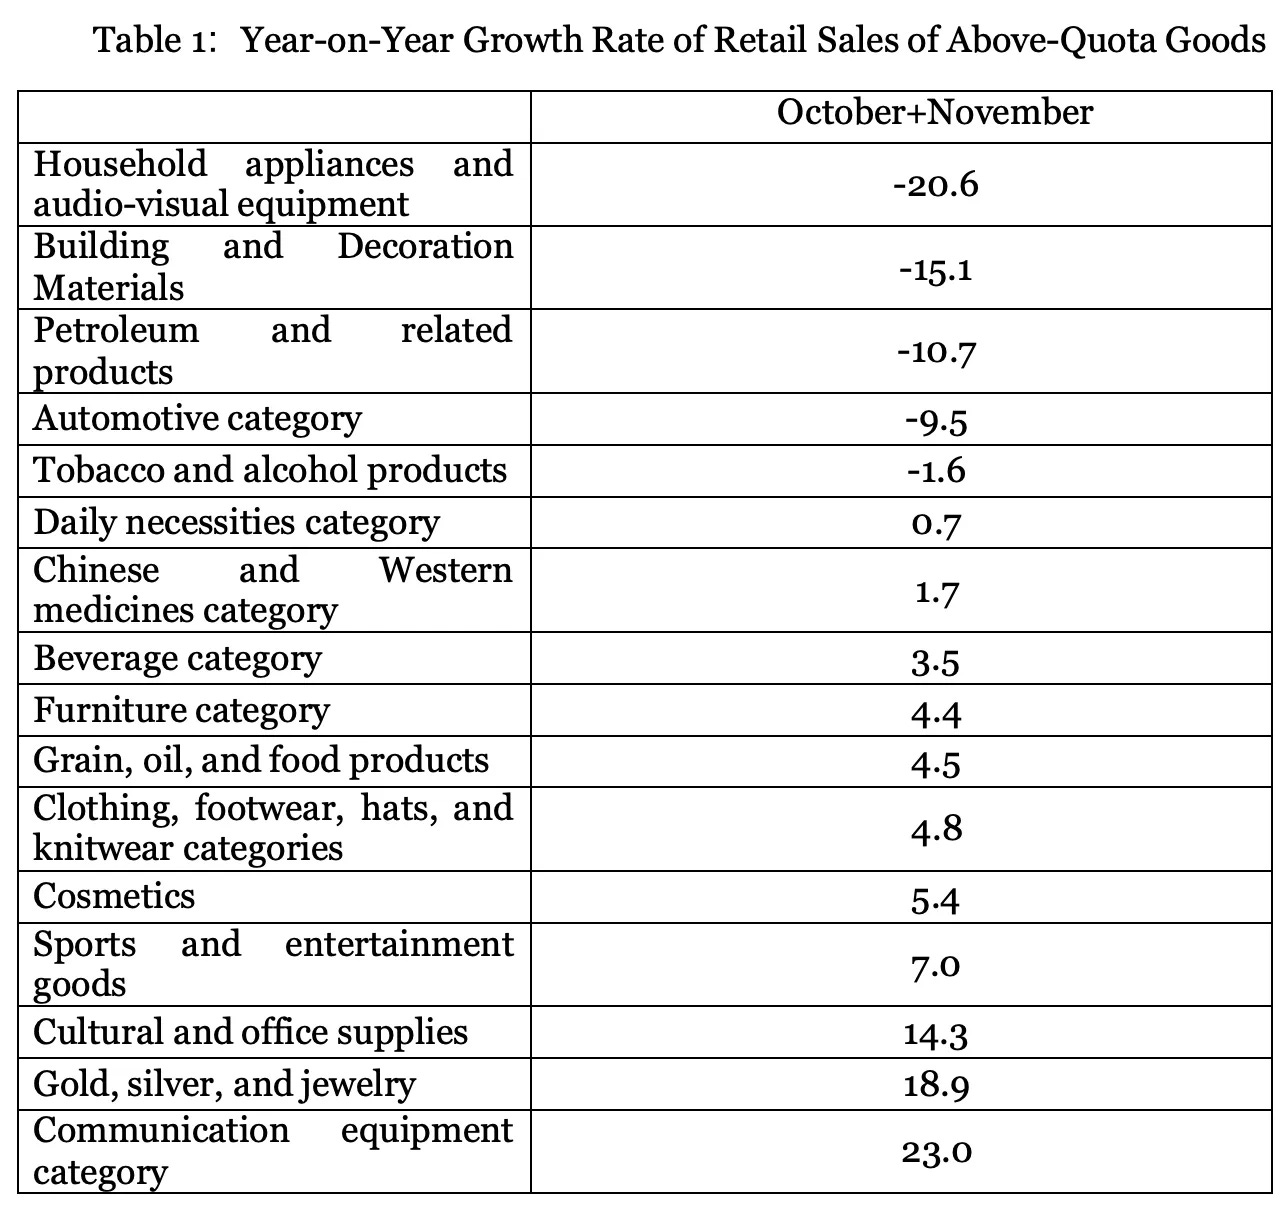
Data from October and November (combined) paints a clear picture of the structural divergence in Chinese spending.
“Discretionary” and “feel-good” categories are growing. Cosmetics (+5.4%), Sports & Entertainment (+7.0%), and Gold/Jewelry (+18.9%) saw decent growth.
Housing-related sectors are deep in the red. Building and decoration materials plummeted -15.1%, and household appliances fell -20.6%.
Categories with lower growth rates mainly included building and decoration materials, tobacco and alcohol, daily necessities, and Chinese and Western medicines. Among these, the relatively low consumption of building and decoration materials may be related to the accelerated weakening of commercial housing sales in the second half of the year.” [CF40 Research]
This reinforces our view that the consumption slump is not uniform—investors should focus on alpha rather than beta, and avoid staples and sectors tied to the property market downturn.
This year’s Double 11—China’s largest e-commerce shopping festival—delivered a muted performance. The tapering of national consumption subsidies was a key factor.
Take JD.com as an example. As one of the platforms that benefited the most from subsidy policies, JD saw GMV growth in October–November 2025 (including both overall and self-operated businesses) come in well below last year’s pace.
To unlock the full analysis on e-commerce sales (Tmall/JD/Douyin), luxury sales, and the latest salary trends in the job market, consider becoming a paid subscriber. To get a sense of what is offered, you are welcome to check out this older post in the same series: Charts of the Week. You can also get free access by sharing us.
Paid subscribers enjoy a variety of benefits, including discounts on other quality China content, and more timely discussions in our private Discord channel for paid readers. Check out the benefits: exclusive benefits for Baiguan’s paid subscribers.
