


Do China’s capital markets actually contain companies that qualify as genuinely “disruptive innovation”? If China had a fund similar to ARK Innovation, would it have performed better or worse over the past several years? And would it provide a better representation of where technological innovation is actually happening in China than traditional benchmarks such as the CSI 300 or Hang Seng TECH Index?
With that question in mind, I decided to build my own “Chinese version of ARKK.”
Of course, it is not a replica of ARKK. ARKK is an actively managed ETF run by ARK Invest, with portfolio managers selecting stocks according to their own interpretation of disruptive innovation. But if I were to look back today and simply pick the most successful Chinese technology companies of the past several years, the result would inevitably suffer from serious hindsight bias. So instead, I fixed the rules first, let those rules determine what the portfolio would hold, and named the resulting backtested portfolio China Disruptive Tech (CDT).
I did not initially expect it to perform particularly well. After all, we all know how poorly Chinese technology stocks have performed over the past several years.
If China were truly good only at manufacturing and copying rather than disruptive innovation, then this “Chinese ARKK” should, in theory, have performed worse than the American original.
The result surprised me. In June 2026, CDT reached a new high for the entire backtest period, while ARKK was still about 48% below its February 2021 all-time high. Since 2020, even after the sharp selloff in Chinese assets from July through November 2026, CDT has still generated a cumulative return of roughly +252%, versus about +62% for ARKK.
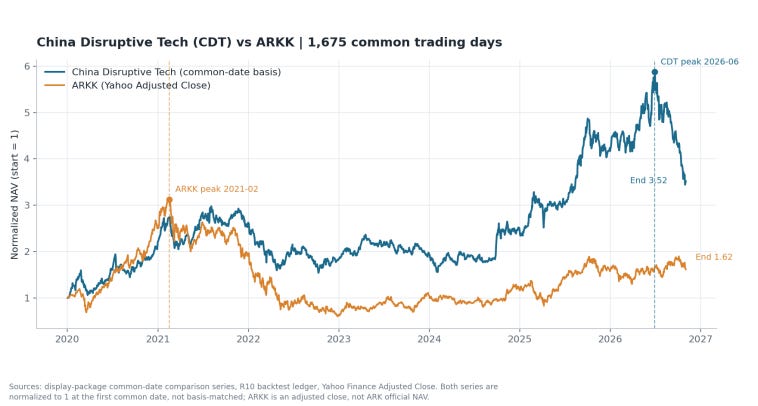
More interestingly, across 1,675 identical trading days, the correlation between their daily returns was only about 0.18. In other words, American disruptive-innovation assets and Chinese disruptive-innovation assets have shown surprisingly little synchronization over the past six years.
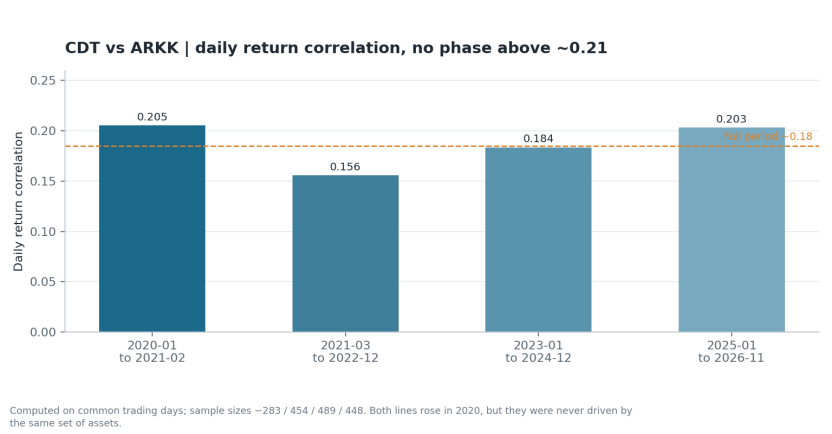
What really interests me is not simply that “the Chinese version of ARKK outperformed the American ARKK.” The more important question is: Why did two baskets of assets that are both described as “disruptive innovation” end up behaving like two completely different types of assets?
I think that question is far more interesting than the final return numbers themselves.
Background: How was CDT constructed?
CDT is not a replica of ARKK. I simply borrowed the question that ARKK asks: which companies could use technology to change the way the world works? The difference is that I cannot engage in active stock selection after the fact, because doing so would inevitably introduce hindsight bias into the backtest. CDT therefore used fixed rules from the outset, with no discretionary intervention based on subsequent share-price performance.
First, I limited the potential universe of “disruptive innovation” companies to industries related to emerging technology. Whether a company could enter the candidate pool depended primarily on whether, at that point in time, it possessed an important technological breakthrough or genuinely disruptive technology—not on the size of its revenue or market capitalization. Over the past six years, a total of 51 companies have entered the candidate universe.
To actually enter the portfolio, however, a company also had to satisfy a second layer of requirements, including having been listed for at least 10 trading days, having a market capitalization of at least RMB 5 billion, and meeting minimum trading-volume and liquidity thresholds. The reason is straightforward: many small companies may appear to possess disruptive technologies, but if they are too small or commercially weak, they may never be able to turn those technologies into meaningful economic value.
CDT holds a maximum of 25 companies and weights them according to the square root of their historical market capitalization. Eligibility and rankings are reviewed at month-end, while full screening and rebalancing take place quarterly. This design allows genuine winners to gain weight as their market capitalizations rise, while preventing any single company or theme from expanding without limit.
So what determines what CDT owns is a set of conditions, not a fixed list of companies. It is not “my selection of the best Chinese technology companies.” It is the outcome produced by a set of rules defined in advance.
I. CDT vs. ARKK: When did the two types of disruptive-innovation assets begin to diverge?
Phase One: They looked like part of the same technology bull market
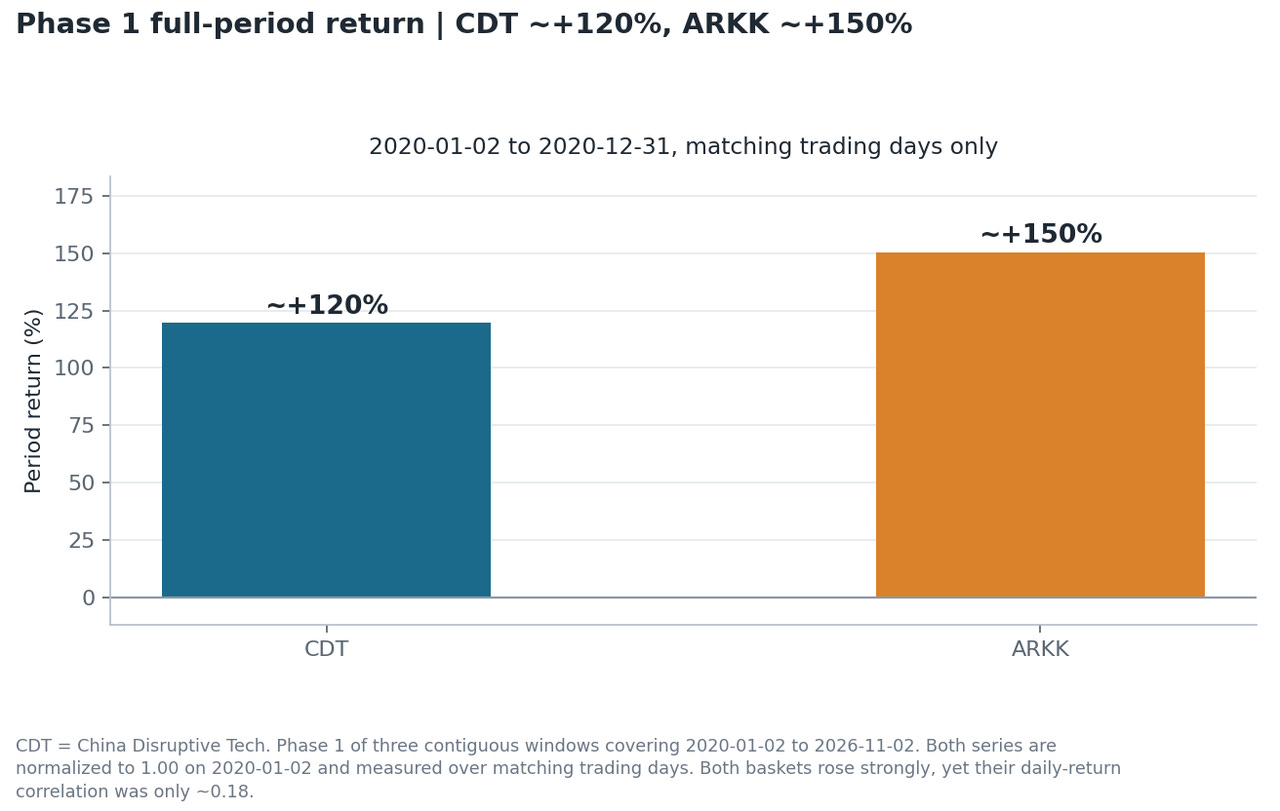
I define the beginning of 2020 through the end of 2020 as the first phase. Using matching trading days, CDT rose about 120%, while ARKK rose about 150%. ARKK peaked around February 2021, and CDT also entered a cyclical peak soon afterward. Looking only at prices, the two appeared very similar at the time, as though both were participating in the same global technology bull market.
But once you look inside the portfolios, the differences are already visible. ARKK’s major holdings included Tesla, Roku, Teladoc, Shopify, Square and Zoom, representing electric vehicles, internet platforms, telemedicine, e-commerce and digital applications that expanded rapidly during the pandemic.
CDT, by contrast, already had a much stronger manufacturing and industrial-supply-chain character. Its top ten holdings around February 2021 included BYD, CATL, BeiGene, Sungrow, SMIC, CanSino Biologics, Innovent Biologics, Montage Technology, NAURA Technology and Junshi Biosciences, representing electric vehicles, power batteries, solar inverters, semiconductor foundries, semiconductor equipment, innovative drugs and vaccines.
So although both portfolios were rising at the time, their underlying economic drivers were already beginning to diverge. ARKK leaned more toward platforms, applications and long-term growth, while CDT had already developed a much stronger exposure to manufacturing, equipment, capacity and orders.
Phase Two: CDT fell less, while ARKK suffered a much more severe valuation collapse
The second phase was the bursting of the innovation-technology bubble. In 2022, the Federal Reserve entered a rapid rate-hiking cycle and valuations for global growth stocks compressed sharply. This gave us a useful window for observing just how differently the two groups of innovation assets responded to rising rates and valuation compression.
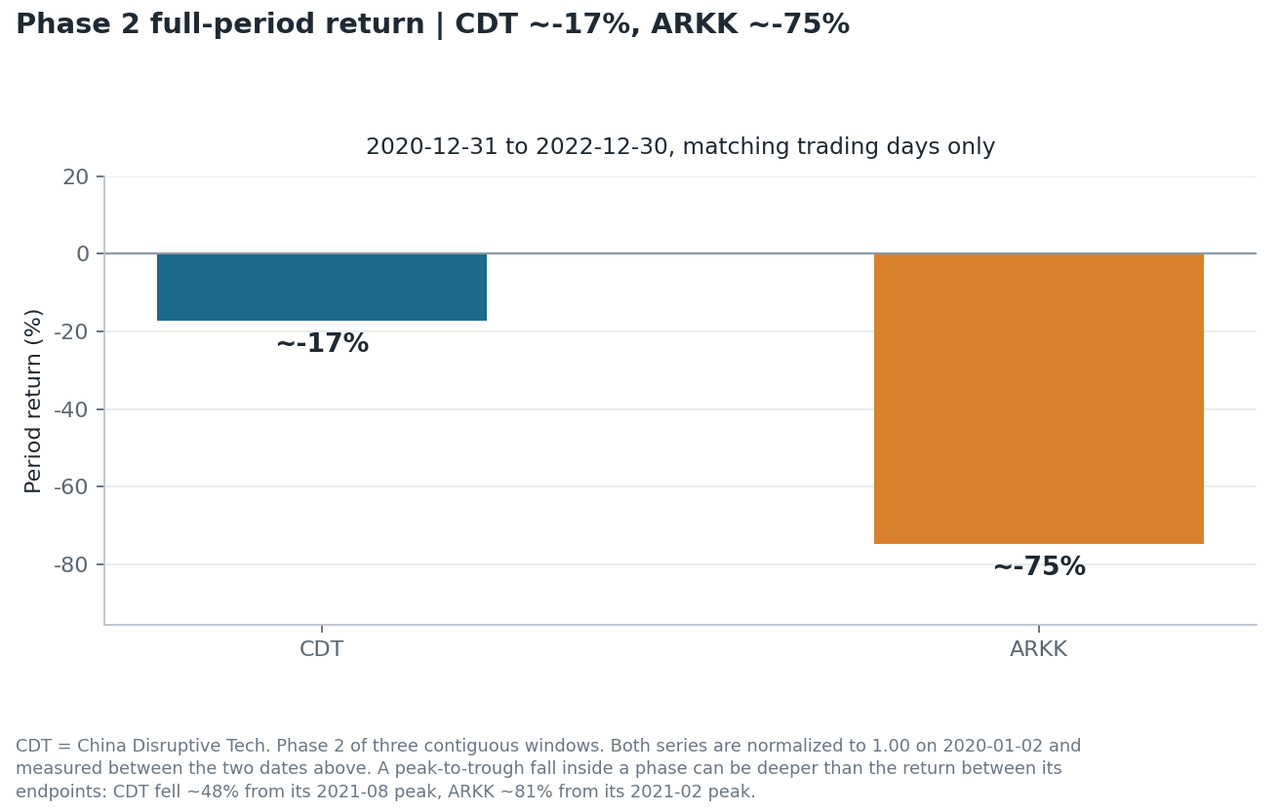
From its August 2021 peak to its October 2022 trough, CDT suffered a maximum drawdown of roughly -48%, and it did not return to its previous high until February 2025, leaving investors underwater for roughly three and a half years. That was clearly already a very severe bear market.
But ARKK fell much more dramatically. From its February 2021 high to the trough around the end of 2022, its maximum drawdown was approximately -81%. Using the same start and end dates for this phase, CDT ended the period down roughly 17%, while ARKK was still down around 75%.
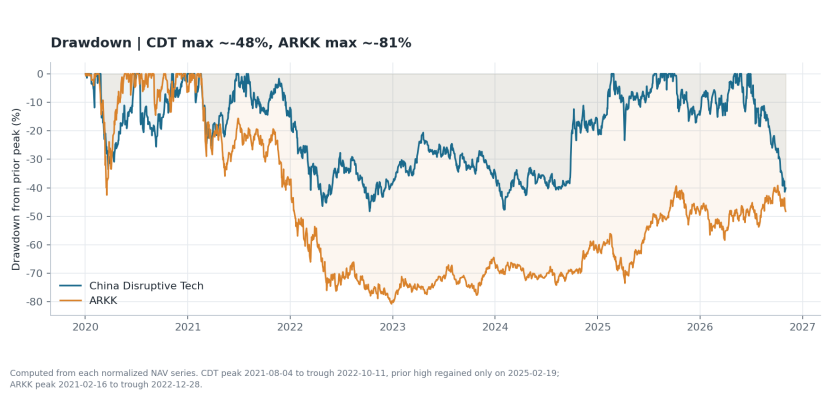
Why was the difference so large? In my view, one important reason is that ARKK behaves more like a classic long-duration asset: much of its value comes from cash flows that lie far in the future. When risk-free rates rise quickly, the present value of those distant cash flows falls sharply, putting enormous pressure on valuations.
CDT also went through a valuation bubble and suffered a severe drawdown, but it contained many battery, automobile, solar-equipment, semiconductor-manufacturing and semiconductor-equipment companies. Their value depended not only on future narratives, but also on current capital expenditure, orders, production capacity and shipments. That did not protect CDT from a bear market, but the difference in business models changed its sensitivity to interest rates and valuation compression.
Phase Three: ARKK won on period returns, but CDT reached a new high sooner
I define the period from the end of 2022 through November 2026 as the third phase. Its defining feature was the emergence of AI as the most important driver of the global technology industry, with virtually every major technology market being repriced around the AI supply chain.
Looking only at returns during this phase, CDT rose about 93%, while ARKK gained roughly 155%, so ARKK clearly performed better. That is not surprising: US technology stocks were in a strong bull market, while Chinese assets suffered another very sharp correction from July through November 2026.
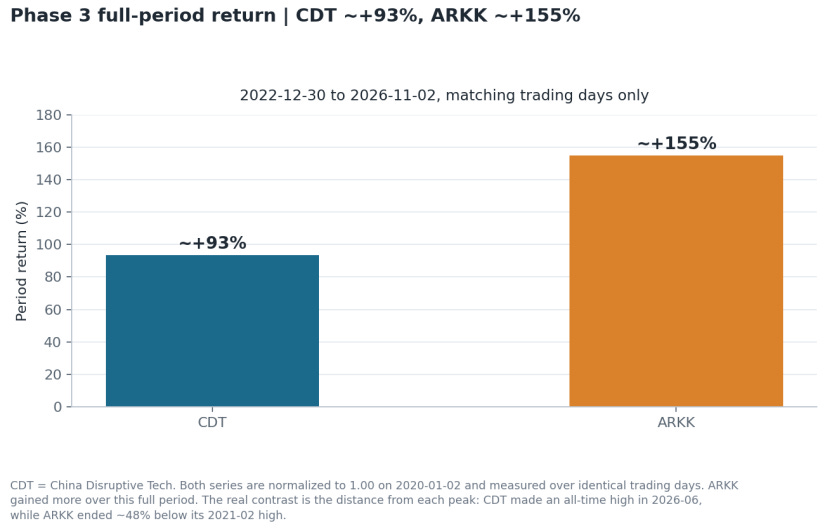
But the picture looks different from another angle. CDT had already reached a new high for the entire backtest period by June 2026, while ARKK, despite several years of recovery, was still roughly 48% below its 2021 all-time high.
So this phase really needs to be viewed through three different questions. If we look only at returns from 2023 through 2026, ARKK performed better. If we ask which portfolio recovered the previous bubble-era peak first, CDT did. And if we look at cumulative returns over the full period since 2020, CDT still comes out ahead.
That is why I do not think “which one outperformed?” is the most interesting question. What really needs explaining is: why did two assets that are both called innovation follow such different paths?
II. CDT vs. ARKK: Are they actually two completely different types of assets?
1. Two peaks, driven by two different industry cycles
Around the 2021 peak, ARKK’s major holdings included Tesla, Roku, Teladoc, Shopify, Square and Zoom. The portfolio contained electric-vehicle exposure, but also a large number of platforms, software companies and internet applications that had grown rapidly during the pandemic.
CDT held something very different. Its top ten holdings in February 2021 included BYD, CATL, BeiGene, Sungrow, SMIC, CanSino Biologics, Innovent Biologics, Montage Technology, NAURA Technology and Junshi Biosciences, covering electric vehicles, power batteries, solar inverters, semiconductor foundries, semiconductor equipment, innovative drugs and vaccines. Compared with ARKK, the portfolio was more diversified and had a much stronger manufacturing and physical-supply-chain orientation.
So if I had to summarize the difference between these two types of assets, I would put it this way:
ARKK’s core value comes more from future growth → future cash flow → valuation → discount rates;
CDT, especially in the most recent industry cycle, has increasingly depended on capital expenditure → orders → capacity → shipments → current earnings.
In other words, even though both are described as “disruptive innovation,” the economic variables actually driving their share prices are different.
2. The post-2022 rebound: one benefited more directly from orders, while the other depended more on valuations and long-term growth
Why was CDT eventually able to reach a new high? One important reason was not that it had become more like ARKK, but that it had become increasingly concentrated in the parts of the supply chain that were paid first during this capital-expenditure cycle.