Do Chinese households feel confident again?
Rounding up recent data points that are still largely ignored by the market


One of the most important questions about China’s economy right now is whether and when household confidence could stabilise, ending the deflationary sentiment that has dominated the last few years.
After government’s resolve to boost domestic consumption, curb over-production and a stock market bull, it’s safe to say the “whether” part of that question is already resolved. The question now mainly surrounds “when”.
FD of Robonomics, an investment memo-style publication that I avidly read, recent made some observation about her recent trip to China (her own emphasis):
Confidence is a big part of the game, and it feels like the average person has made peace with the new normal. Coffee shops are packed. Consumer energy feels back, and people seem confident again… Consumer confidence seems meaningfully improved. Shanghai IFC Mall traffic is strong; regular cafes are packed with middle-class families and afterschool kids….A key driver is the stock market wealth effect: the Shanghai index being up sharply since the Oct-2024 lows has made “hope” feel investable again for a lot of people…The right frame is K-shaped - but the average mood feels less defensive than the last few years.
My own anecdotal observation, as someone who is based in Shanghai and travels regularly inside the country, is also the same as Freda. It’s clear the sentiment in the air feels very different from the vibe 2 years ago.
But subjective experience can be misleading too, bound by the information bubble created by my small social networks and life experience. To have a complete picture, we also need to check what data has to say.
In the following sections, I will use several KPIs review this question.
The Kentucky Fried Chicken index
One of my favorite proxies to understand deflationary pressure in China is to read YUM China’s quarterly results and find the average selling price of Kentucky Fried Chicken.
KFC is a popular fast food dining brand and the largest restaurant chain in China. It’s also one of the cheaper dining options out there. In other words, KFC is easily the least-cost producer in China’s dining sector. The simple rule of thumb is that if deflation stops in China, it will inflect first at KFC. Conversely, if deflation at KFC doesn’t stop, we definitely are not out of the woods.
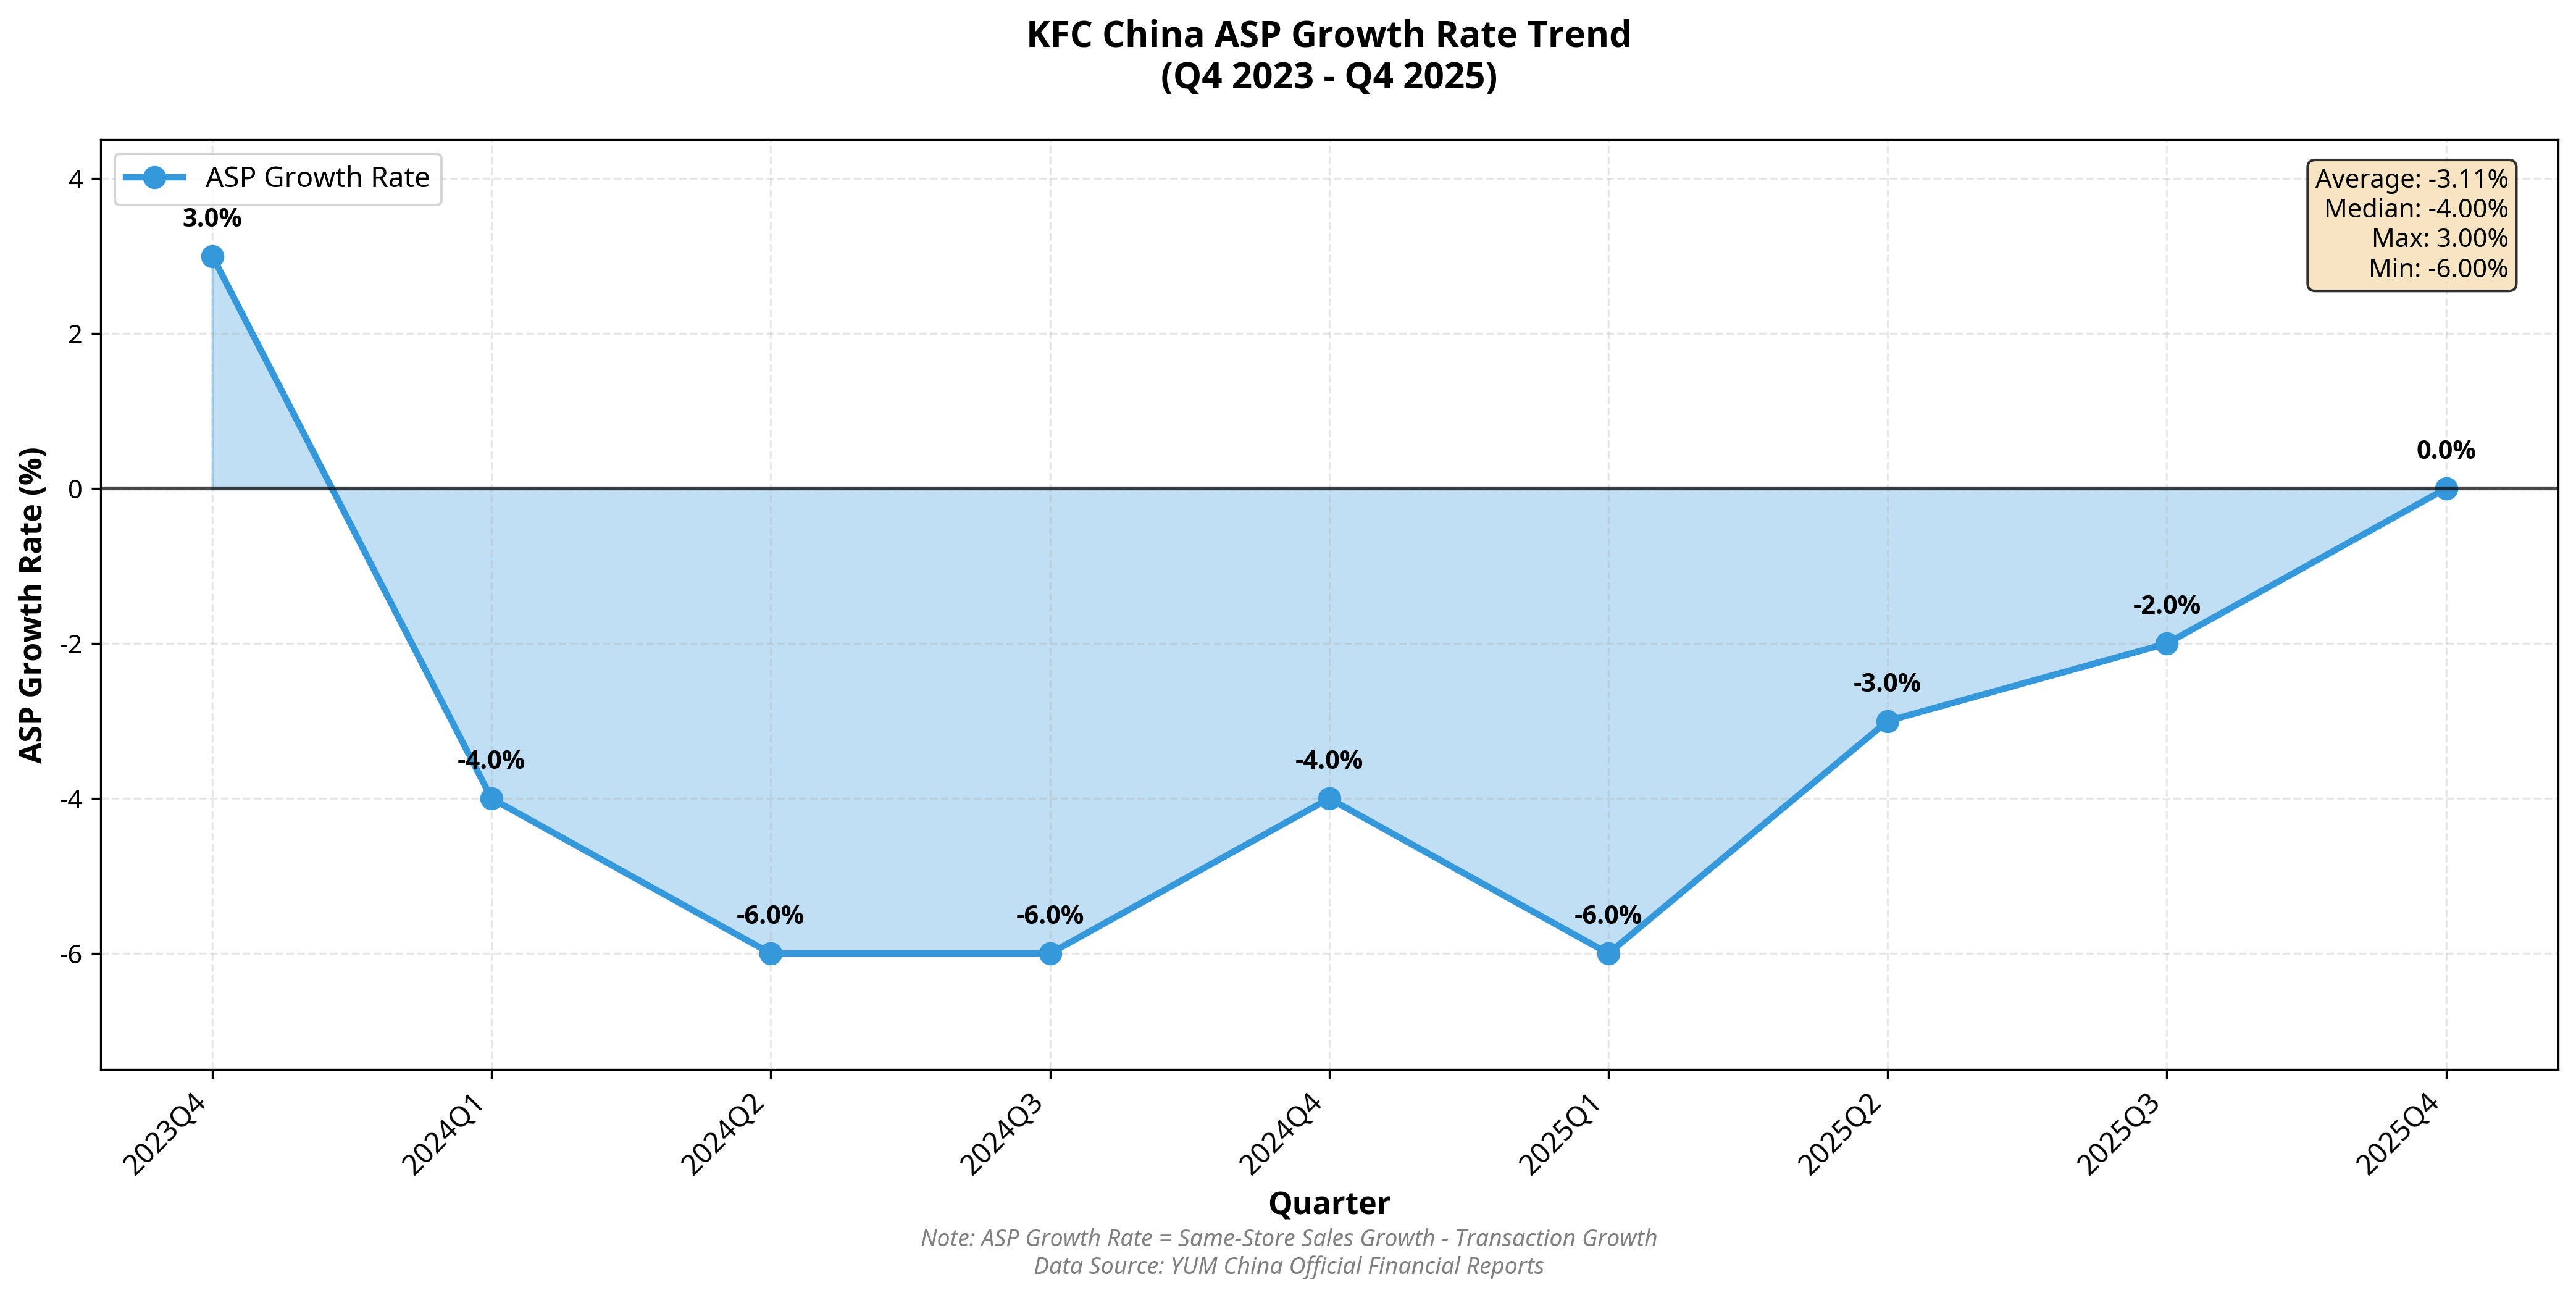
In the last many quarters, same-store transaction volume has kept growing, but same-store sales grew much more slowly than volume, which means ASP has been declining, and that people are consuming more chicken wings but paying less for each.
The just-announced 25Q4 results, however, marked the first quarter in a long while that the ASP actually stabilized at KFC.
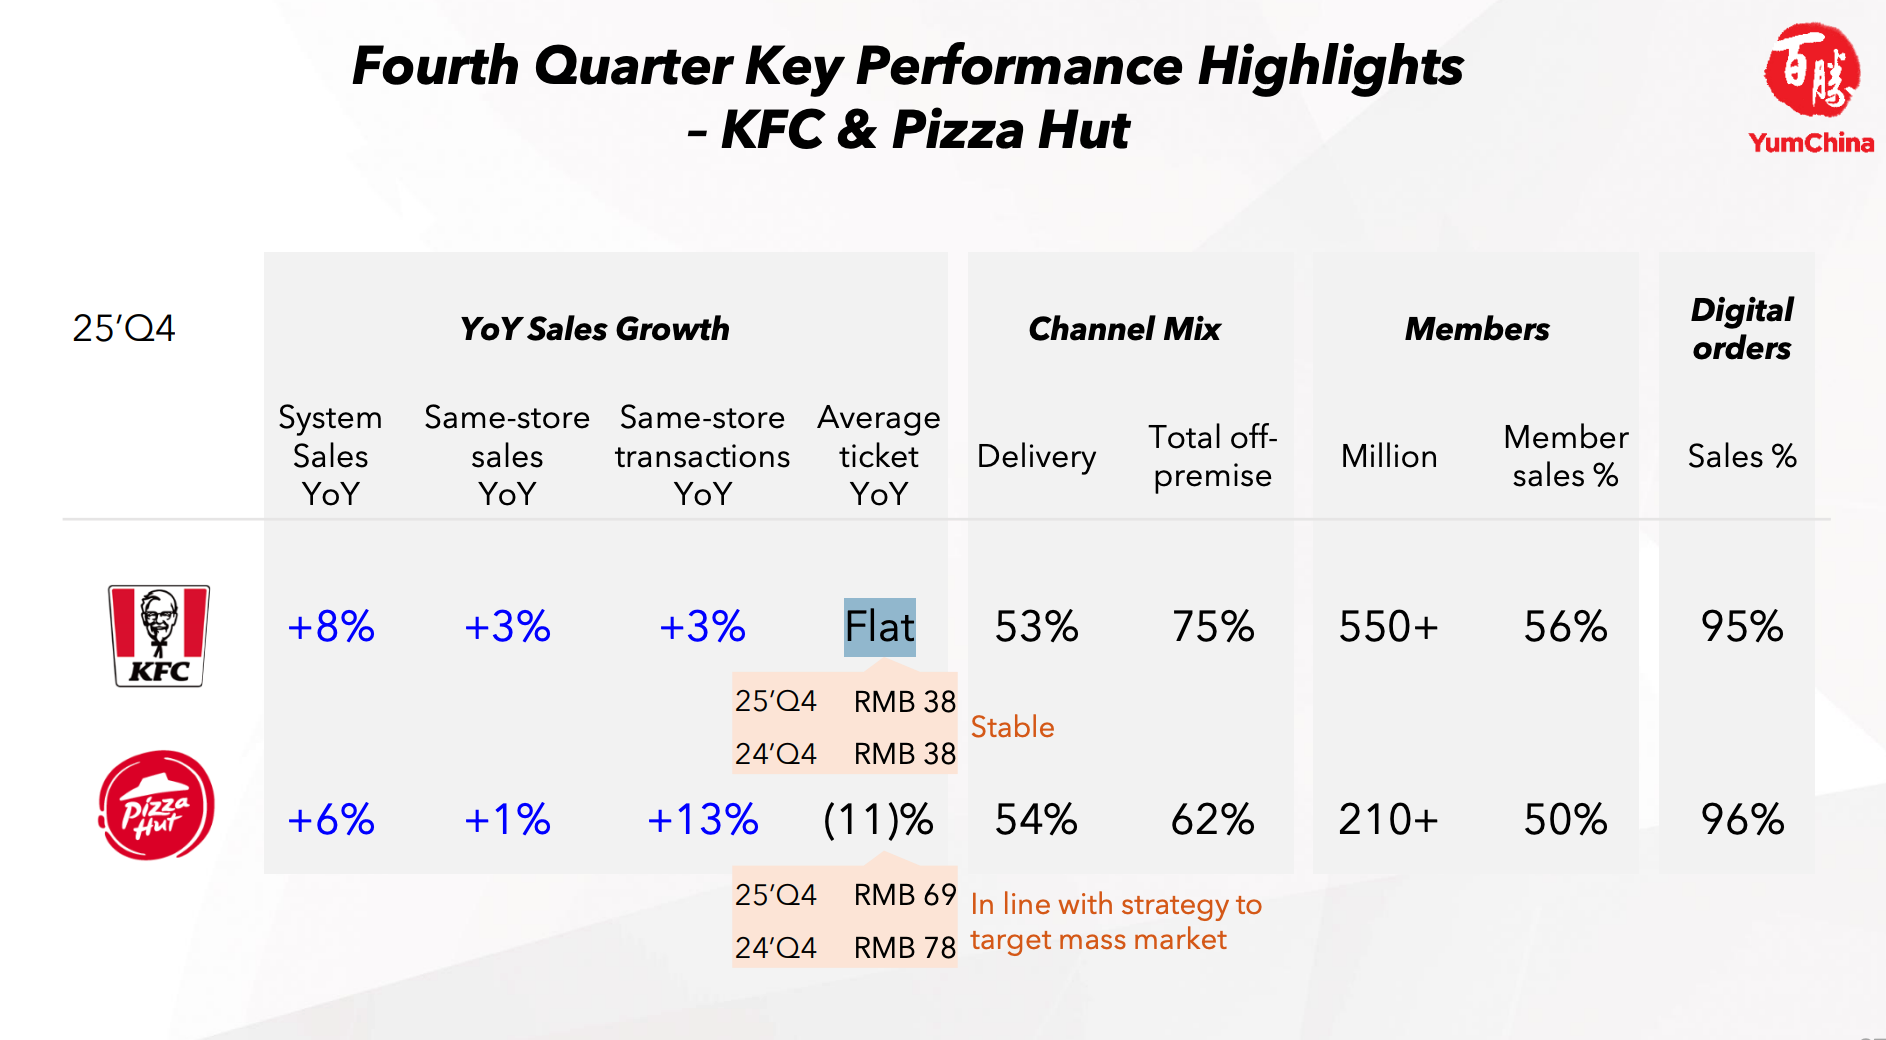
To be more precise, this comes after 7 quarters of ASP decline. The trend seems undeniable.
The China Resident Risk Appetite Index (CRRAI)
To find data series more representative than chicken wings, I look to the CRRAI which is designed to quantify the financial behavior and confidence of Chinese households. It has been created by Bob Chen, a friend of the channel who has contributed several pieces here before.
Bob constructed CRRAI upon 4 thematic pillars, each capturing a distinct layer of the household financial decision-making process:
Macro Liquidity & Business Confidence: This dimension serves as the systemic backdrop, gauging the availability of broad market liquidity and the overall health of the business environment through indicators such as the M1-M2 spread, government bond yields, and manufacturing and service PMIs.
Household Leverage & Credit Dynamics: This reflects the willingness of households to take on debt. It tracks variables such as long-term and short-term loan growth, deposit term-lengthening, and non-bank financial deposits growth, usually a forerunner of household capital rotation into financial markets.
Fundamental Bedrock: Risk appetite is constrained by asset values and income security. This dimension monitors the “wealth effect” and the stability of the household balance sheet using metrics such as secondary housing prices, property sales volumes, and employment data.
Capital Market Sentiment: This most reactive component captures “animal spirits” and speculative momentum within secondary markets. It synthesizes signals such as margin trading ratios, valuation levels (P/E ratios), trading intensity, and new brokerage account openings.
This is what CRRAI looks like right now:
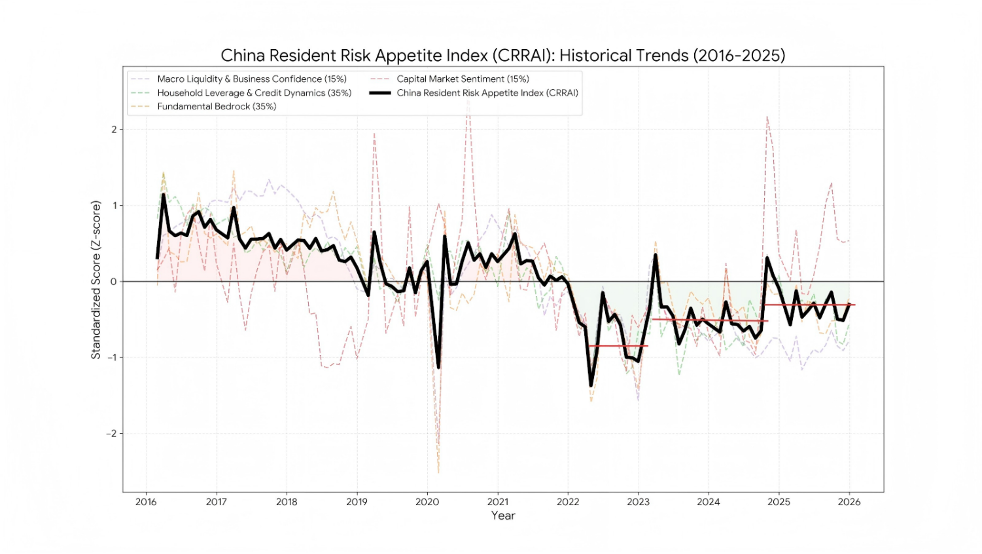
It’s clear that from this perspective, the lowest level of household confidence in the past decade was seen during 2022. Since then, we have seen a year-by-year, staircase-like recovery.
A defining feature of the late-2025 landscape is the persistent lead of Capital Market Sentiment. For 2025, this dimension turned positive as early as August and peaked in September. Although it moderated slightly toward the end of the year, it remains the only pillar comfortably above the historical mean. This sentiment front-running was driven by the recovery of the Chinese stock market, a surge in retail participation, and a sharp increase in non-bank financial deposits, which acted as a forerunner for capital rotation into financial assets.
On the other hand, the most encouraging signal in December was the rapid recovery of the Fundamental Bedrock pillar, which rose from -0.47 to -0.21. This improvement reflects a stabilizing job market and a marginal recovery in secondary housing transactions. Historically, a sustainable “risk-on” environment requires the composite index to be supported by these “real economy” pillars.
Despite these recoveries, Macroeconomic Liquidity and Household Credit Dynamics continue to weigh on the overall index. The “water level” in the system remains low, with the M1-M2 spread still indicating sluggish capital activation. Furthermore, while the pace of deleveraging has slowed, the willingness of households to expand their long-term balance sheets (mortgages) has not yet returned to growth.
But if they can continue their upward trajectory into Q1 2026, the index is well-positioned to break above the neutral threshold, marking a definitive end to the multi-year “risk-off” cycle.
Ratingdog China PMI
Ratingdog China PMI, formerly known as Caixin PMI, is the unofficial macro-economic indicator that the market is watching closely. The one sub-index that I pay the most attention to is the service PMI because the service sector is more directly related to domestic consumption rather than the manufacturing sector.
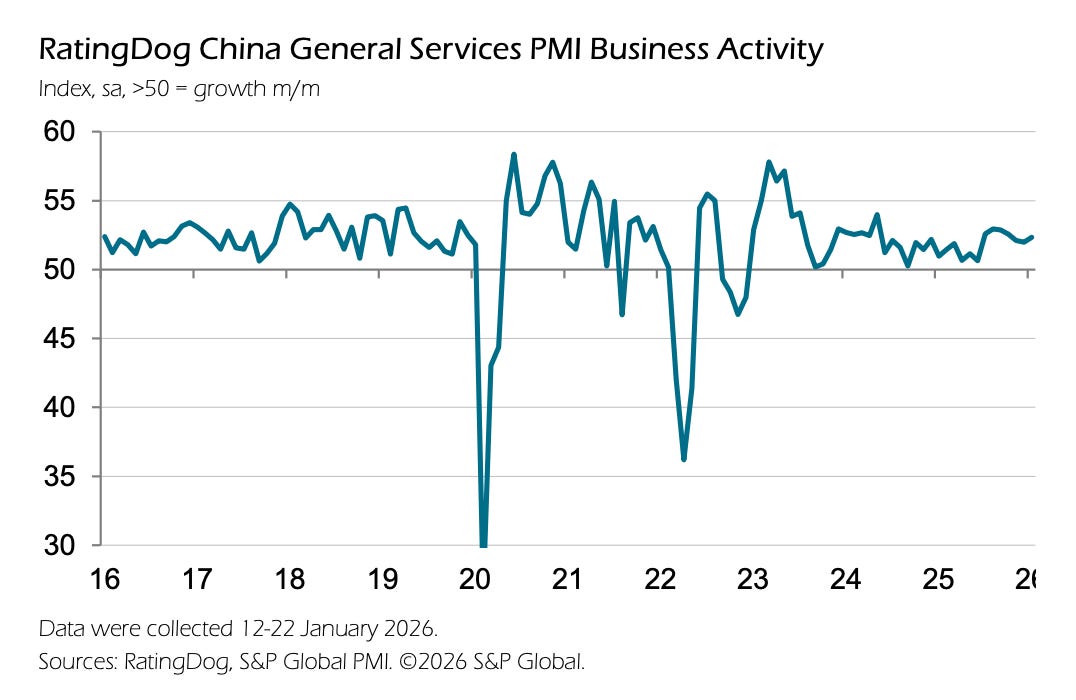
This data series suggests that China’s services sector has entered 2026 on a firmer footing, with this reading rising to 52.3, the strongest reading in three months.
Yao Yu, founder of Ratingdog commented:
Service sector business activity accelerated in January, primarily driven by faster growth in total new business.
Employment returned to expansion, with a slight increase in backlogs. Supported by sustained inflows of new business, service sector firms saw improved demand for labor, with the employment index rising into expansionary territory for the first time in six months.
On the price front, cost pressures eased somewhat. Input costs rose for the eleventh consecutive month, driven mainly by higher fuel and purchased item prices, but the reading fell to a five-month low. The decline in selling prices eased, with the reading essentially returning to the breakeven level, indicating some relief in terminal pricing pressure.
Overall, the service sector started the year on a stable footing. Looking ahead to February, consumption-oriented services such as culture and tourism, catering, and instant retail may see growth driven by the extended nine-day.
The Services PMI is expected to remain in expansionary territory. From a medium- to longterm perspective, the slight dip in business confidence suggests that external uncertainties remain a constraining factor. The sustainability of the service sector’s recovery will still depend on the strength of domestic demand improvement.”
(Ratingdog is the creator of YY Rating, which is perhaps the most objective credit rating system in the PRC at the moment. If you are interested in getting in contact with them, please shoot us a message at baiguan@bigonelab.com)
Official CPI…
So far, we haven’t even looked at official statistics yet. But we should.
Many observers have this unconscious bias that the numbers made by Beijing are not trustworthy. We may write a separate post about this topic in the future. But in a nutshell, we believe that most of the official data is quite dependable. Its credibility gap compared with other major economies has also visibly shrunk.
So what do official statistics tell? Let’s look at the consumer price index (CPI).
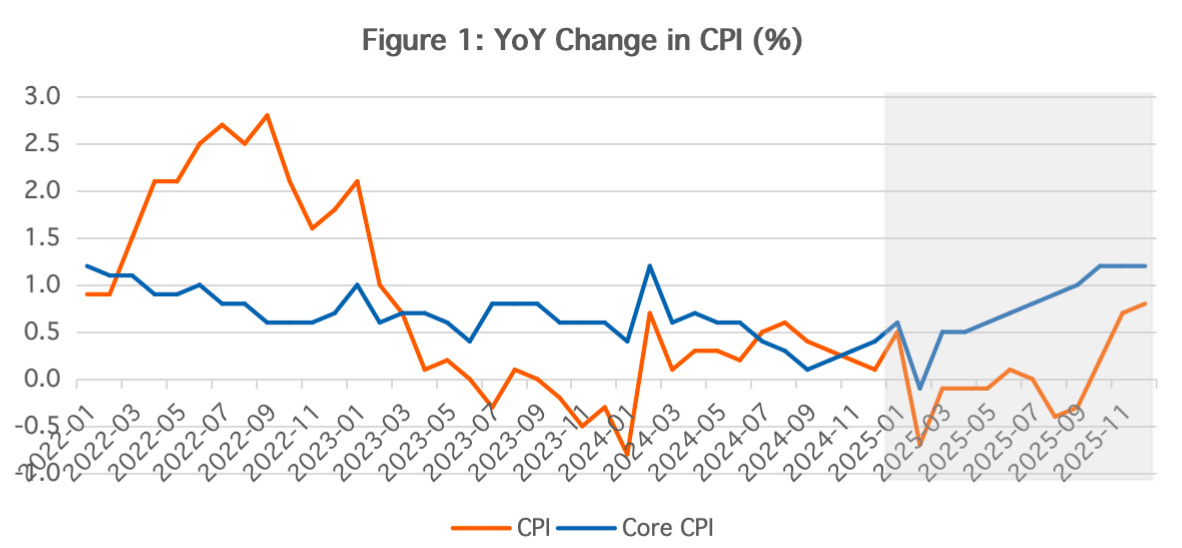
Clearly, CPI has hit some kind of inflection point in 2025Q4, with YoY change decidedly entering positive territory.
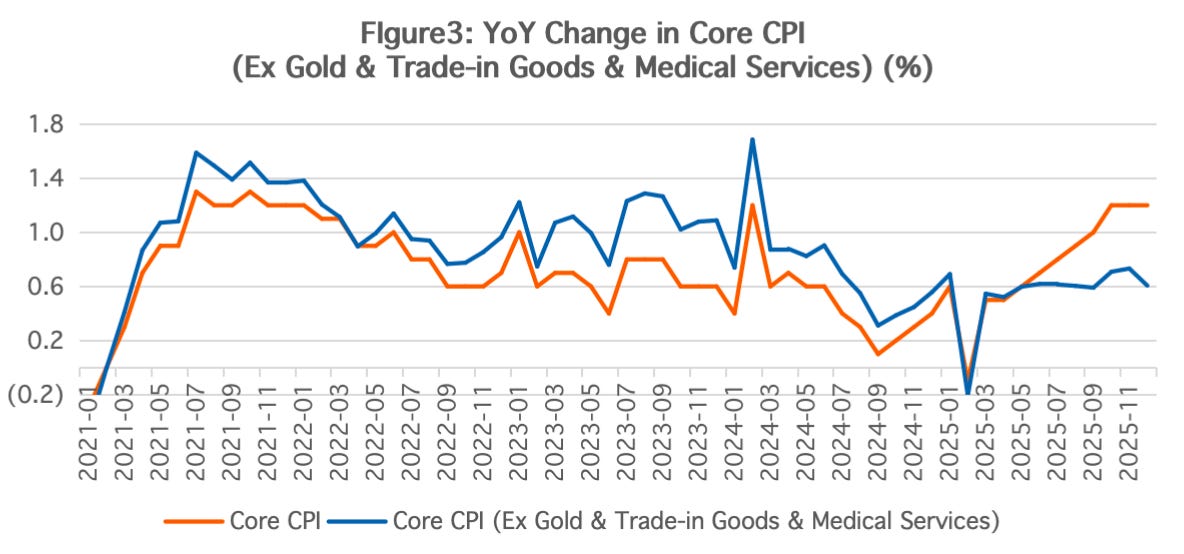
Core CPI, which excludes food and energy components that are susceptible to seasonal and non-economic factors, did even better. Throughout 2025, the core CPI steadily recovered, gradually rising from 0.5% yoy in March to above 1% yoy in the fourth quarter.
Researchers at CF40, our partner think-tank, did some further digging by segmenting core CPI into several main factors.
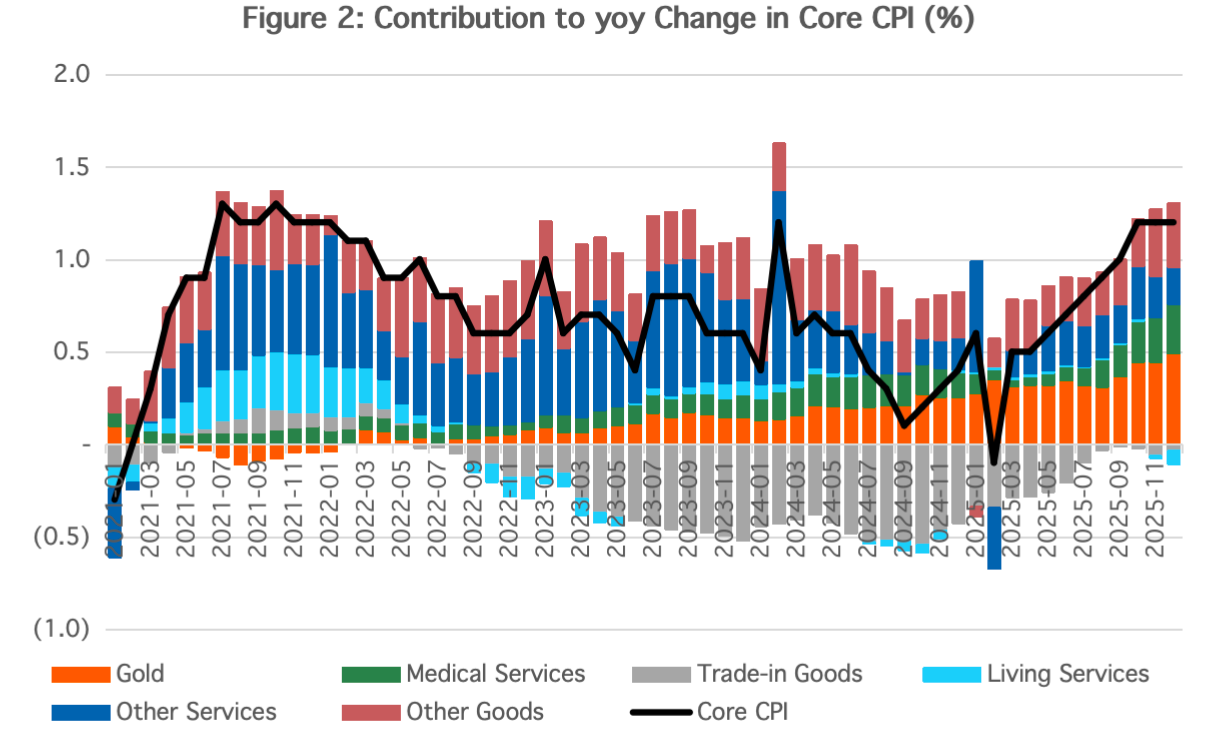
CF40 showed that there are three components that made significant contributions to core CPI growth in 2025: gold jewelry, trade-in goods, and medical services. Although these three components account for approximately 22% of core CPI, their average contribution to core CPI throughout 2025 was around 40%. The increases in these components were all driven by exogenous (international gold price hike) or policy-related factors (trade-in subsidies and continuous advancement of healthcare payment reforms).
To better look at the “core” core CPI without the influence of these exogenous factors, CF40 made an adjusted core CPI by excluding these three components. The final, adjusted core CPI yoy growth remained essentially flat at around 0.6% across all months in 2025. However, this flat trend, which came after significant growth moderation in the previous years, suggested that China’s core CPI has indeed bottomed out and stabilized.