


"Charts of the Week" is Baiguan's series that features key data points to help you quickly grasp the general state of affairs in China in just a few minutes. We handpick the highlights of the data charts from a variety of sources, analyzing and delivering insights trusted by 100+ top institutional and corporate clients worldwide at BigOne Lab. Don't forget to subscribe before you continue reading!
If two keywords capture what has been happening on the ground recently, I believe they are "frontload" and "price for volume." On one hand, much demand has been frontloaded, whether it's external demand due to export frontloading, or domestic demand boosted by national subsidy and trade-in programs for home appliances, new energy vehicles, computers, and other digital electronics. On the other hand, as deflationary pressure persists, gaining market share in domestic market has become increasingly challenging, as exemplified by recent price wars between JD and Meituan, in the EV sector, and other industries.
Today, PDD's share tumbled over 19% after announcing its Q1 earnings with a 39% drop in profit—this to me sounds like a prime example that investors are beginning to "get back to reality" and attend to the ongoing "involution" amidst a deflationary environment. More discussions around "involution" in other industries will surely be coming soon in the upcoming months.
So, back to reality, despite the 90-day pause, the effective tariffs at 30% are still higher than those before the Trump administration. I believe much of the optimism has already been priced in, and we likely need to see stronger macro data to sustain the current momentum.
As the good news gets digested, I think the market will begin asking more questions like "what happens after the 90-day pause?" and "what are the new positive surprises on the consumption-boosting side?”
Today, I've picked 13 charts to illustrate recent shifts in household sentiment in China and to explain why we might see less "euphoria" and more of a return to reality in the coming period.
Reality 1: Deflationary pressure persists
Looking at offline dining (which we track through a nationwide panel of restaurants), one of the areas that consumers were happy to spend on, the average selling price has been declining year-on-year since 2024 H2 (despite a momentary positive YoY in December last year). In April, the average selling price declined 1.9% year-on-year.

Similar patterns were seen in online consumption: the total sales volume increased, but the average selling price decreased for most categories, except for those supported by national subsidy programs. Jewelry & gifts were one of the few categories where both the volume and average selling price continued to rise, mainly due to gold and gold jewelry purchases and the rising gold prices.

Reality 2: Income expectation isn't improving as much
On the wealth effect side, the real estate market is showing a similar “price-for-volume” pattern.
Our latest data (for the week of May 18–24) shows that the transaction volume of existing homes across 90+ Chinese cities increased by 18% year-on-year.
However, property viewings — a leading indicator of home purchase intent — declined by 5% week-on-week,

And transaction prices continued to trend downward.

The real estate market has been stabilizing, but it certainly hasn't yet returned to a point where households feel their assets are appreciating again.
On the job security side: The good news is that surviving companies are seeing an increase in average job postings per company. Both the total number of jobs and hiring companies ticked up year-on-year this March — albeit at a more moderate pace compared to March of last year.

But on social media (Red Note and Douyin), more people are discussing and reacting to posts mentioning "layoffs",

and engagement for posts mentioning “salary cuts” also spiked in April, albeit with less intensity compared to 2022 and 2023.

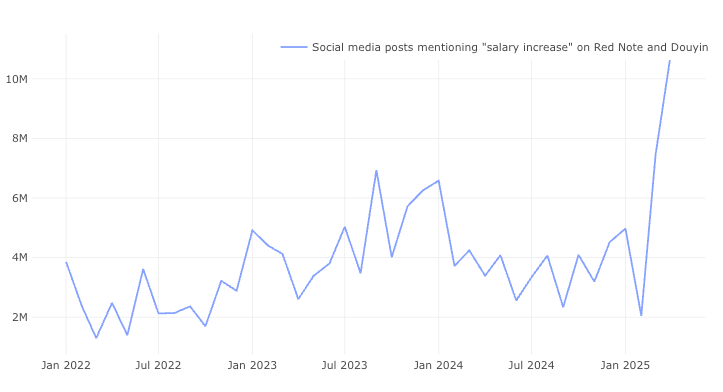
The good news is that engagement with posts mentioning "salary increase" spiked to the highest level since 2022 this April:
*this excludes keywords such as "no salary increase."
So I reasonably assume that income expectations are holding up better for those who still manage to secure a stable job, but overall, concerns about job loss still loom.
Fewer people have been engaging with posts mentioning 'quitting without a backup plan' or 'changing jobs' since the second half of 2024, as the competitive job market no longer offers as many mobility opportunities as before,
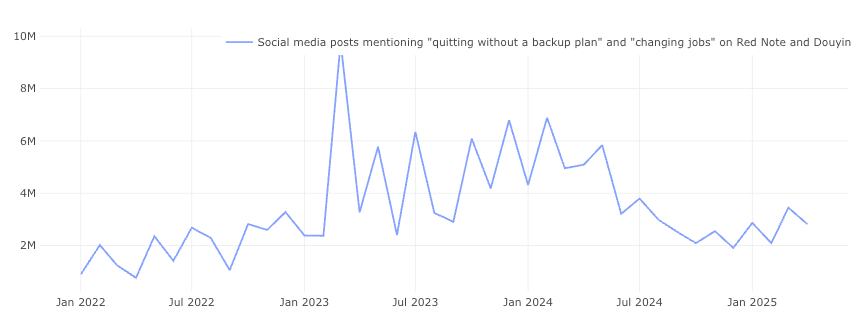
especially considering that yet another record-breaking graduating class of over 12 million college students is entering the job market this summer. (Just think about this number: the total workforce in China directly exposed to U.S.-bound exports is estimated at around 10 to 20 million. I wouldn’t say tariffs are the biggest problem for China’s job market.)
Continue reading consumer sentiments on social media and my thoughts on the equity market. To get a sense of what is offered, you are welcome to check out this older post in the same series: Charts of the Week. You can also get free access by sharing us. For more timely discussions, consider joining our private Discord channel for paid readers.
