

The Real China AI Bull Market the World Missed: But Is the Bubble Already Too Big?
But Is the Bubble Already Too Big?


On April 1, we officially launched Baiguan Pro, our professional-tier subscription designed for investors seeking deeper, more specific coverage of Chinese equities. If you missed our launch piece, you can read it:

As a reminder, existing paid subscribers can claim a complimentary upgrade to Baiguan Pro by the end of July by simply replying to this email at baiguan@bigonelab.com.
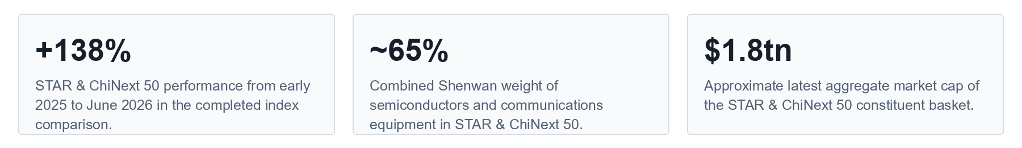
China’s tech indices are outperforming many peers, including the Nasdaq 100, led by AI-infrastructure enthusiasm and the Chinese hardware supply-chain companies with real positions in the global AI buildout. From early 2025 to early June 2026, the STAR & ChiNext 50 rose about 138%, far ahead of the Nasdaq 100’s 46%, making it one of the clearest public-market expressions of China’s new technology cohort. This is not a broad-market story, and most offshore-listed internet giants familiar to global investors have been left out of the rally.
That may sound counterintuitive after years of drawdown and weak global confidence. But China’s core technology assets have quietly become some of the world’s strongest performers. The STAR & ChiNext 50 index tracks leading companies across Shanghai’s STAR Market and Shenzhen’s ChiNext board, and it has become the cleanest listed proxy for this shift.
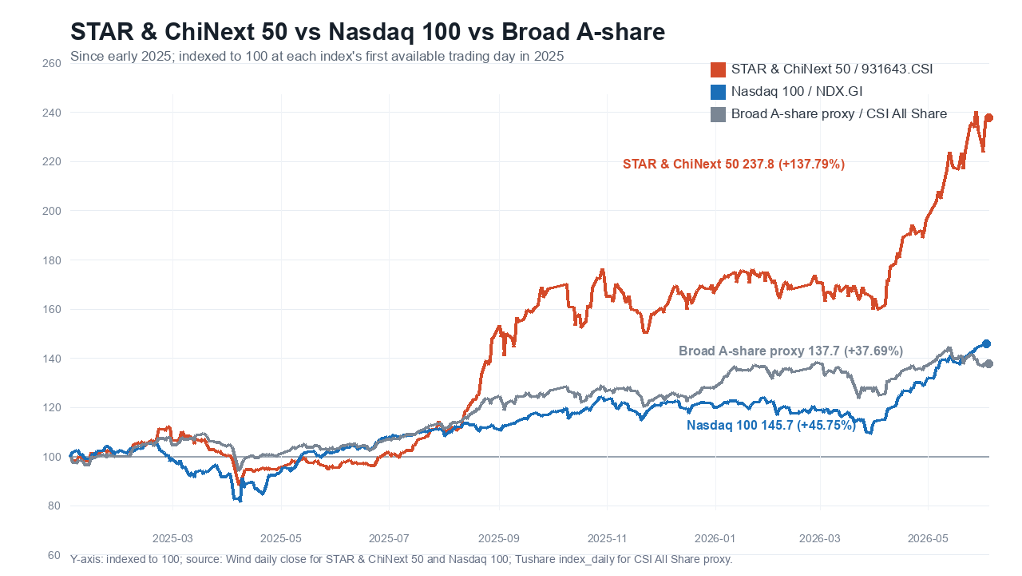
Adding a broad A-share proxy makes the dispersion visible: the AI-infrastructure-heavy STAR & ChiNext 50 has led dramatically, while the broad China market has lagged far behind the AI basket.
Part of this is base effect after a long bear market that lasted until the September 24, 2024 policy pivot. But the deeper point is that China now has a large, liquid, investable universe exposed to AI infrastructure. That has begun to draw global attention. ProShares has recently filed for 2x leveraged products tied to some of the most representative A-share AI-infrastructure names, including Zhongji Innolight and Eoptolink. These companies may still be unfamiliar to many non-China investors, but inside China they have become market celebrities, closer in recognition to what SK Hynix represents in Korea’s AI supply-chain trade.
For many overseas investors, China tech still means Alibaba, Tencent, Baidu, Meituan, JD.com, and a few other offshore internet companies. That lens is increasingly stale. The listed offshore internet giants are, in many ways, AI laggards: their revenue structures remain heavily exposed to weak domestic consumption, large-company bureaucracy has slowed AI execution, and the most aggressive Chinese hyperscaler, ByteDance, is still private. (More articles will be coming on how domestic investors view the star names of Alibaba and Tencent.)
This creates a perception gap. Most foreign investors still look at the familiar ADR basket and see uneven AI monetization. Domestic A-share investors are looking instead at upstream hardware, semiconductor localization, optical modules, PCB, MLCC, power infrastructure, and other supply-chain chokepoints.
At the center of that spotlight is the STAR & ChiNext 50. The index selects leading companies from Shanghai’s STAR Market and Shenzhen’s ChiNext board, two venues designed around China’s innovation economy, growth companies, and strategic emerging industries. It is therefore a useful public-market proxy for China’s listed hard-tech complex: not the whole A-share market, but a concentrated basket of the companies investors are using to express AI-infrastructure and advanced-manufacturing exposure.
The result is also highly uneven. China’s AI-infrastructure leaders have pulled far ahead of the broad A-share market. In that sense, China is developing its own version of technology-weight-led index performance: a concentrated group of large AI beneficiaries is carrying the headline story, even as the broader market remains far less exciting.
Index Anatomy: The real China tech basket is hard-tech, not offshore-listed internet giants
The STAR & ChiNext 50 is now overwhelmingly a hard-tech benchmark rather than an offshore-listed internet proxy, a traditional manufacturing basket, or a green-energy index.
The China-specific Shenwan sector classification makes the structure clear: the two largest AI-related buckets are Semiconductors at 33.56% and Communications Equipment at 31.16%. Together, they account for roughly 65% of the STAR & ChiNext 50, making them the index’s dominant components. They have also performed far better than most other sectors, which is why the benchmark behaves less like a broad manufacturing basket and more like a concentrated AI-infrastructure index.
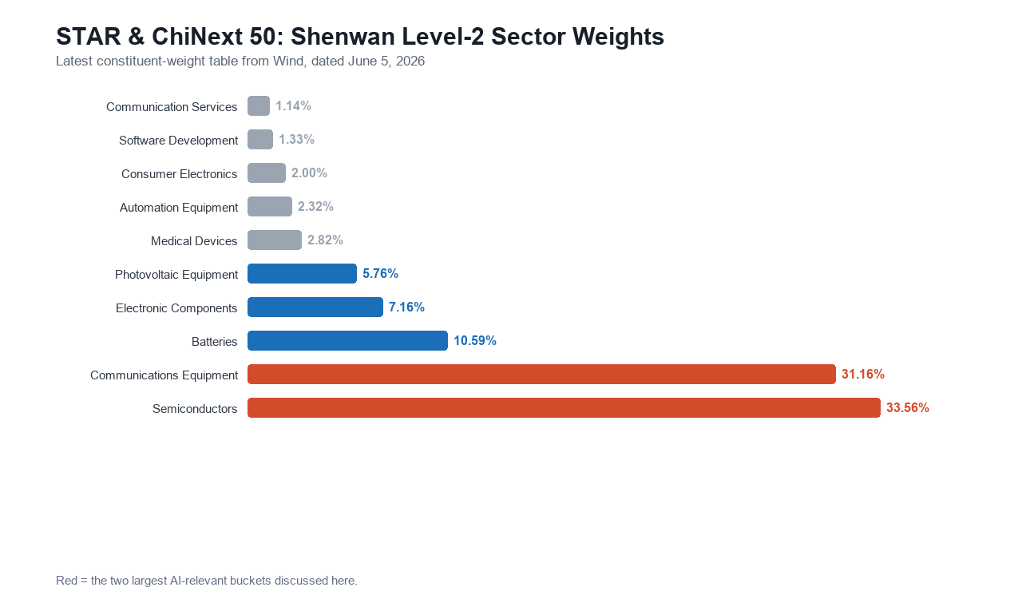
The more China-specific Shenwan lens makes the structure visible: semiconductors and communications equipment are the two largest AI-relevant buckets.
The second implication is more important for this cycle: many A-share upstream hard-tech companies are not merely meme concept stocks. They are direct beneficiaries of the global AI capex cycle. Optical transceivers and optical-component suppliers sell into the high-speed data-center interconnect chain. AI processor, CPU/DCU, and memory-interface companies sit closer to the compute and server architecture layer. PCB, CCL, power, and cooling suppliers are tied to the physical buildout of AI clusters.
In practical terms, these companies are exposed to the same spending wave driven by Nvidia, global hyperscalers, and the AI-server supply chain. Many Chinese technology companies are not only suppliers to domestic internet platforms; in selected links, they are also direct suppliers, qualified vendors, or first-tier suppliers to global AI leaders. The exact route differs by company, but the economics are linked to the same bottleneck the global AI sector is tackling: moving, processing, powering, and cooling far more data inside AI data centers.
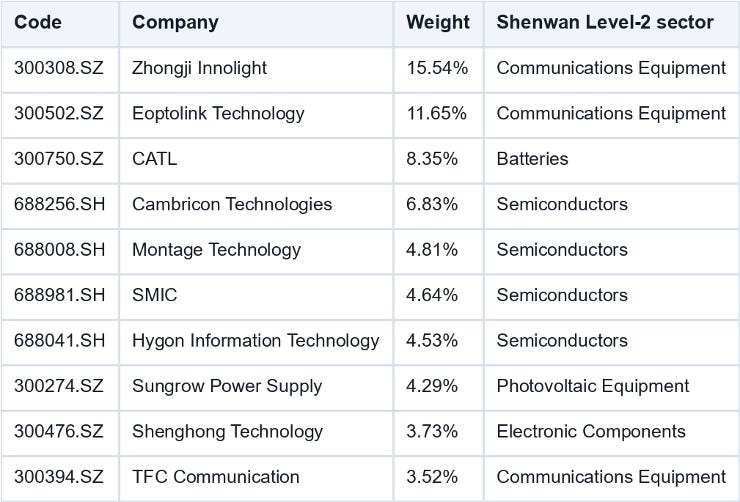
This is why the market-cap expansion has been so dramatic. From the first trading day of 2025 to early June 2026, Zhongji Innolight, a leading supplier of high-speed optical modules for AI data centers, rose from roughly $20 billion to $211 billion in market capitalization, a 10.4-fold increase. Eoptolink, another major optical transceiver supplier for high-speed data-center networks, expanded from roughly $12 billion to $114 billion, a 9.6-fold increase. TFC Communication, a supplier of optical components, subassemblies, and packaging for AI computing centers, moved from roughly $7 billion to $55 billion, a 7.5-fold increase.
On the semiconductor side, Montage Technology, a memory-interface and interconnect-chip supplier leveraged to AI servers, expanded from roughly $11 billion to $47 billion in market capitalization, about a 4.2-fold increase. Cambricon, a domestic AI-accelerator chip company, increased from roughly $40 billion to $126 billion, while Hygon, a domestic CPU/DCU processor supplier for servers and high-performance computing, rose from roughly $48 billion to $98 billion. These are not micro-cap meme stock moves. They are large market-value re-ratings in companies that occupy important positions across the AI infrastructure stack.
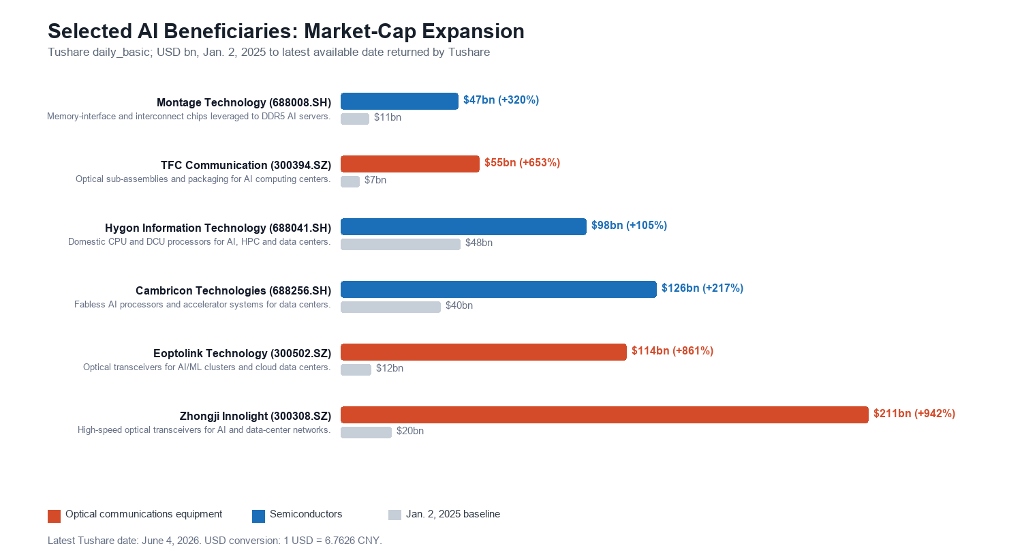
The selected optical communications and semiconductor names are now large enough to absorb institutional capital and influence benchmark composition.
In aggregate, these six selected AI-infrastructure leaders now represent roughly $650 billion of market value, or about 3.3% of the full A-share market capitalization based on the June 4, 2026 Tushare daily-basic data and the article’s USD/CNY conversion. The full STAR & ChiNext 50 constituent basket was about $1.8 trillion, or 9.3% of the total A-share market value, meaning these six AI names alone accounted for roughly 36% of the basket. That is already large enough to matter at any benchmark level, and large enough to change how investors experience China technology beta. This is what makes the cycle different from the usual A-share theme pattern: it is not only a thin group of speculative thematic stocks rising sharply from tiny bases, but a rally in large, index-relevant companies.
That makes the structure look closer to the U.S. market’s Mag 7 experience than to old-style A-share theme speculation. The leadership is narrow, the winners are increasingly heavy in the benchmark, and index performance is being pulled by a small number of companies that sit at the center of the AI infrastructure stack. The result is a structural shift in what “China equity beta” can mean: a China benchmark is no longer only banks, liquor, property, and consumer internet. Increasingly, it carries the weight of AI hardware, data-center infrastructure, and semiconductor localization.
But Is There a Bubble? An A-share-Specific Framework
After the sharp rally of the past year and a half, many of these stocks have already moved into demanding valuation territory. Yet this cycle is not a pure meme trade. Many of the leading companies have visible earnings growth, real order momentum, and a credible role in the global AI supply chain. That is why the debate is difficult: investors worry that the bubble may eventually break, but they also recognize that the earnings base is much more solid than in a typical speculative theme.
That tension creates the need for a framework that fits A-shares’ own market character. A simple valuation screen is not enough, because A-share markets often value the highest believable endpoint rather than the current earnings base.
This is especially true for heavyweight leaders: the market does not always wait to re-rate them step by step through quarterly earnings delivery. I call this a ceiling-valuation approach: first ask how high the imagined ceiling is, then ask how much of that ceiling has already been capitalized into today’s market value. Chinese investors rarely hesitate to preempt the future; when the narrative is strong enough, they can buy aggressively and push valuations to extreme levels before the earnings arrive. In other words, they often pursue growth at the cost of certainty. The same logic also helps explain why the offshore ADR internet basket can suffer from lower valuations: many domestic investors no longer believe Alibaba and Tencent have the same explosive growth ceiling.
This is the core mechanism. When a theme becomes dominant, prices do not wait for profit realization. The market discounts the most optimistic version of the future to the present, so high PE multiples can appear before the earnings arrive, because expectations have already moved first. The uncomfortable part is that the later earnings-delivery phase may be the period when the stock derates and digests the old expectation. Even if actual profits beat the old forecast, the share price can still fall if the market’s view of the future ceiling deteriorates.
That brings us to the key question: how far into the AI expectation cycle is A-share today?
Benchmark: The 2021 new-energy peak is the stress line
To measure the current state of A-share AI expectations, we use a deliberately simple benchmark for reference: the peak of China’s 2021 new-energy cycle, meaning the A-share boom in electric vehicles, solar, wind, storage, and related renewable-energy supply chains.
That was the closest and most relevant historical precedent. It was also a dream-driven industrial narrative, with enormous future addressable markets, manufacturing scale, global demand potential, and a group of companies that began to show explosive profit growth. Coincidentally, energy and information are often treated conceptually as two pillars of technological progress. That makes the 2021 new-energy boom and today’s AI-infrastructure cycle somewhat comparable as market narratives.
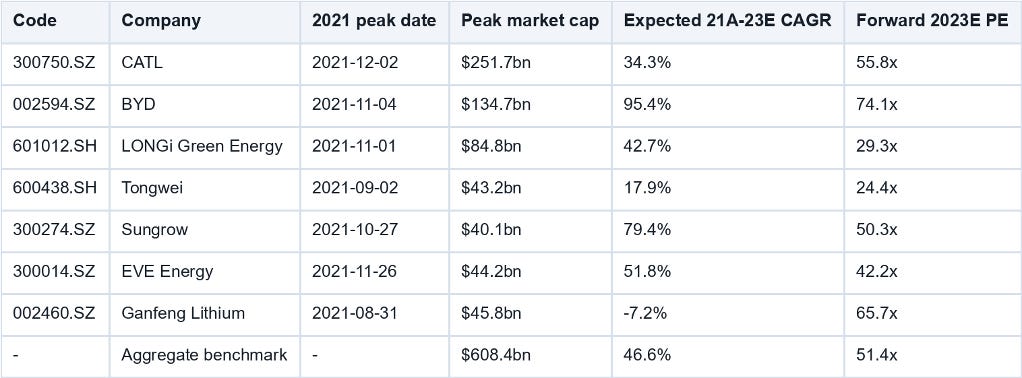
At the 2021 peak, we ask two questions about a representative basket of new-energy leaders. First, what were analysts expecting these companies to earn two years later, in 2023? Second, if those 2023 earnings expectations were realized, what forward PE did the 2021 market capitalization imply?
These two indicators capture the core of the bubble. The first measures the required earnings leap: how fast profits needed to compound from 2021 to 2023 to reach the expected 2023 profit pool. The second measures valuation stress: even if the optimistic 2023 earnings were achieved, how expensive the stocks were at the 2021 peak.
This is what the market often treats as a ceiling: a future profit and valuation level that feels reachable, but high enough to carry the dream. It is somewhat similar to the terminal value in a DCF, except it avoids the complexity and false precision of choosing a discount rate. The point is to use a simple ceiling valuation that many speculators, especially retail investors, can understand, repeat, and sell to others. What about the future beyond two years? It is full of too much uncertainty. The framework deliberately leaves it aside.
The benchmark numbers were striking: for this representative group of core new-energy companies, the implied earnings CAGR was 46.6%, and the aggregate forward PE multiple at the 2021 peak was 51.4x. In other words, at the top of the new-energy cycle, the market believed leading new-energy companies could compound profits at 46.6% annually, and even if they achieved that profit base, the stocks were still trading at 51.4x forward earnings.
That is an extremely optimistic benchmark. We set that historical peak at 100%, then ask how much of that benchmark today’s AI upstream and related A-share themes have already reached.
A rough U.S. reference helps frame the scale. Today, the large-cap U.S. AI and technology complex still screens below the 2021 new-energy peak on this simple two-factor yardstick. Using the Mag 7 as an aggregate proxy, expected FY2025-FY2026 net-income growth is roughly 31% and FY2026E PE is roughly 28x. That does not mean U.S. tech is cheap, and it does not mean the comparison is one-for-one. It simply shows how extreme the 2021 A-share new-energy peak was. The relevant comparison here is between that historical new-energy peak and the current U.S. large-cap AI/tech setup: the A-share bubble benchmark was a far more aggressive combination of earnings expectations and valuation stress.
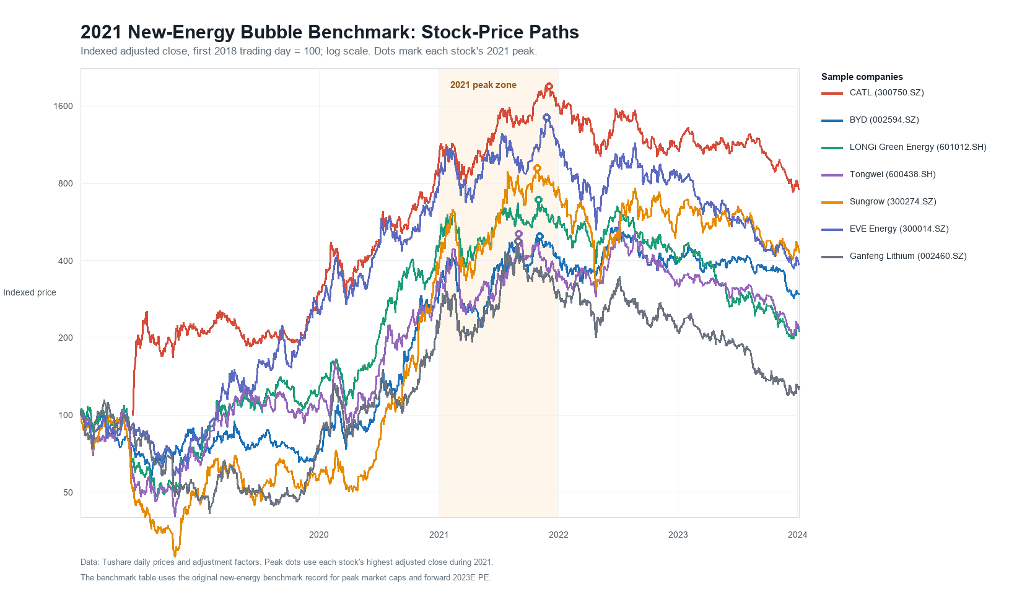
The shaded area marks the 2021 peak zone used to anchor the benchmark. Dots show each stock’s 2021 adjusted-close peak.
The new-energy cycle gives a useful warning. In hindsight, the leading new-energy companies actually delivered 2023 net profits that exceeded the expectations embedded at the 2021 peak. Yet the bubble still broke, because the future ceiling fell for the reasons below. This is the key lesson: in an A-share expectation cycle, the ceiling of belief can matter more than earnings delivery itself.
The stocks did not fall after 2021 because the companies failed to earn money. They fell because the expectation ceiling broke. Domestic demand expectations weakened after the disruptions of 2022. The Russia-Ukraine war and the deterioration in China-foreign relations damaged the global-demand narrative, and the new energy’s imagination space had depended heavily on overseas demand. As overseas policymakers grew more worried about China’s overcapacity and export pressure, restrictions on Chinese new-energy exports also became part of the valuation reset. Most importantly, domestic capacity expanded aggressively. Capital flooded into the industry, local governments competed for projects, and supply growth created brutal price competition.
The lesson is uncomfortable but important: profit delivery does not guarantee stock performance if the market has already priced the ceiling. Once investors begin to fear demand impairment, geopolitical blockage, or supply-side overexpansion, a great industry can become a poor stock-market trade.