


“Charts of the Week” is Baiguan’s series that features key data points to help you quickly grasp the general state of affairs in China in just a few minutes. We handpick the highlights of the data charts from a variety of sources, analyzing and delivering insights trusted by 100+ top institutional and corporate clients worldwide at BigOne Lab. Don’t forget to subscribe before you continue reading!
Last month, we asked: Is China’s Jan–Feb strength organic, or just stimulus? Two pillars are important for answering this question: the wealth effect (real estate) and income (salary). Through the week ending April 11, both still point up.
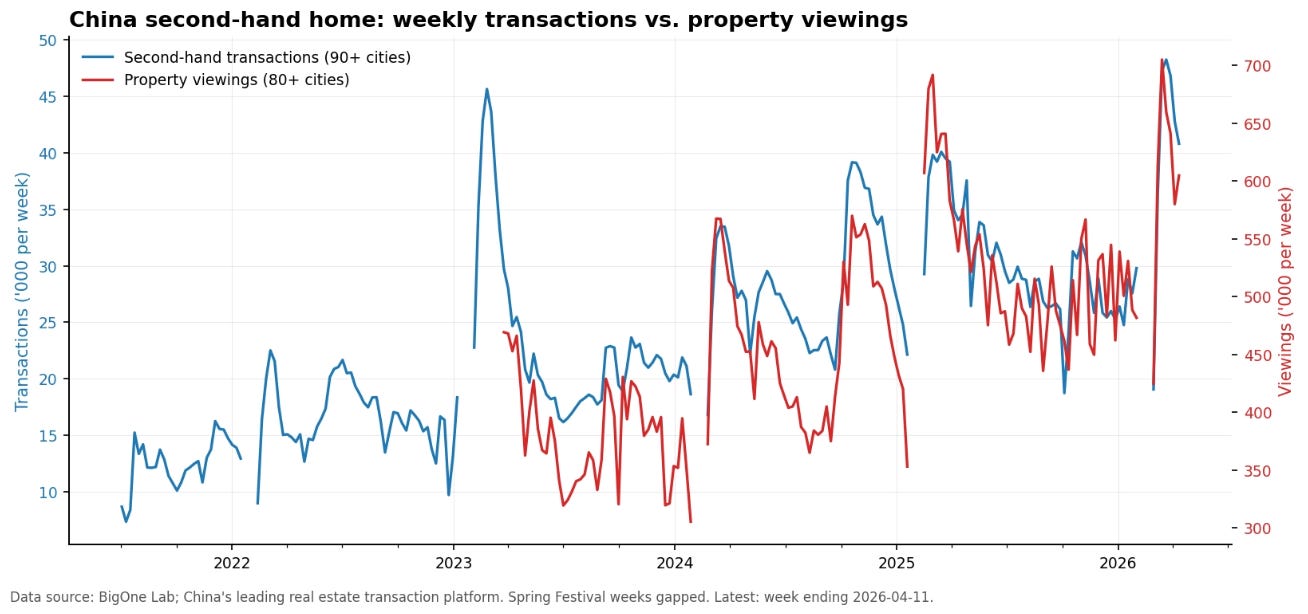
Real estate: activity broadens after the Chinese Spring Festival
Property viewings and transaction volumes are both tracking materially above their 2025 levels following the Spring Festival. Specifically, the transaction volume of second-hand homes has surpassed the peak following the 2023 Spring Festival, when a surge was driven by pent-up demand from COVID.
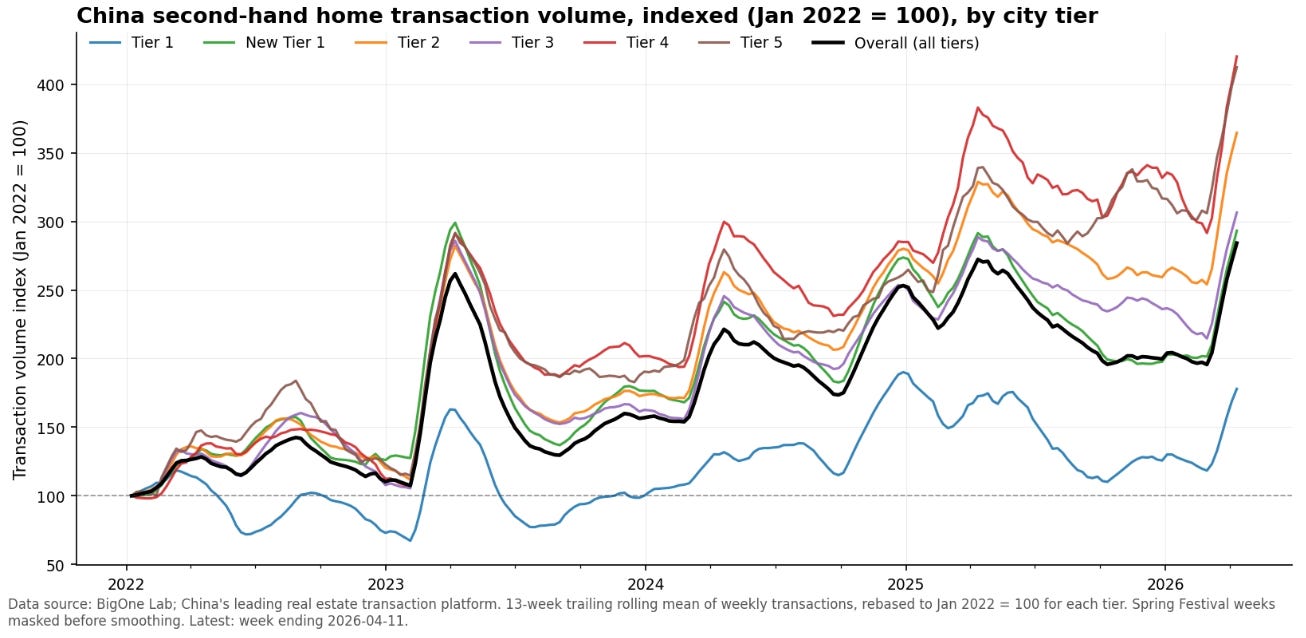
The recovery of the second-hand home transaction also seems even across city tiers:
The inventory level also improved materially across all city tiers, albeit at different paces. Using total listings / weekly transaction volume * 4.33 as a proxy (where 4.33 is just the average weeks per month), the average “months of supply” now trends down for every city tier post Spring Festival.
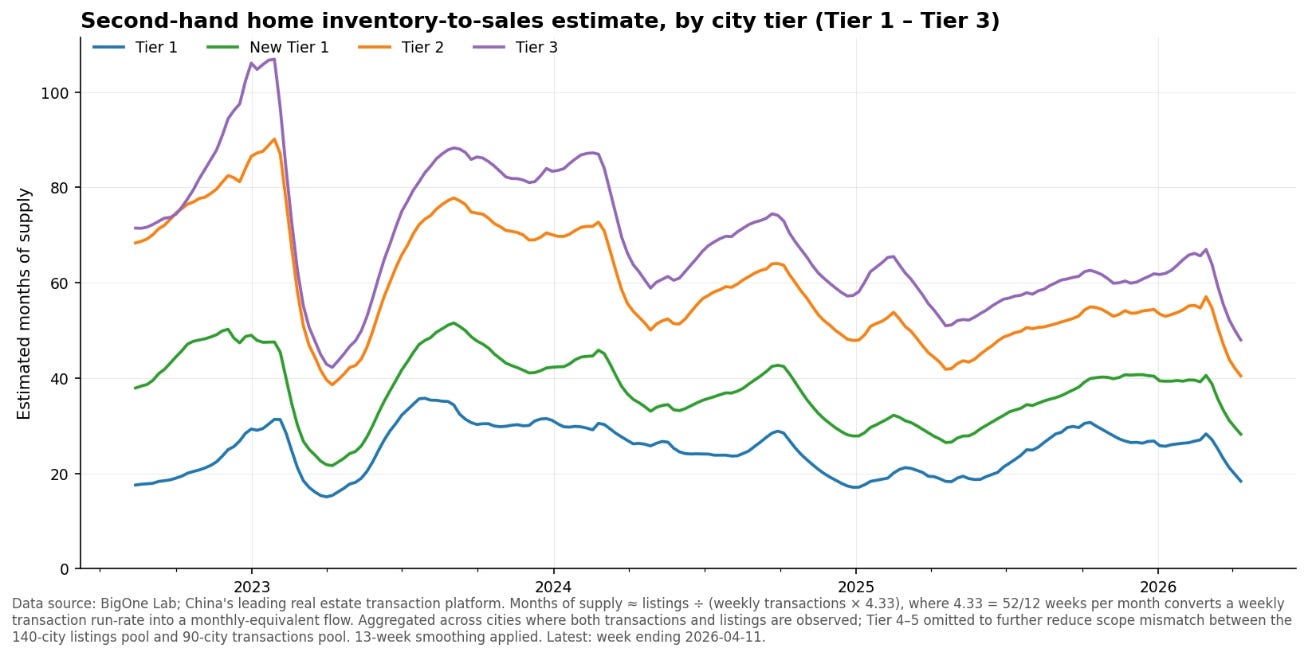
Bottom line: the real estate recovery is widening, not narrowing. Although signs of a strong rebound are not in the near future (we see the listing price still trending down slightly or holding steady), real estate’s weight on the economy is decreasing.
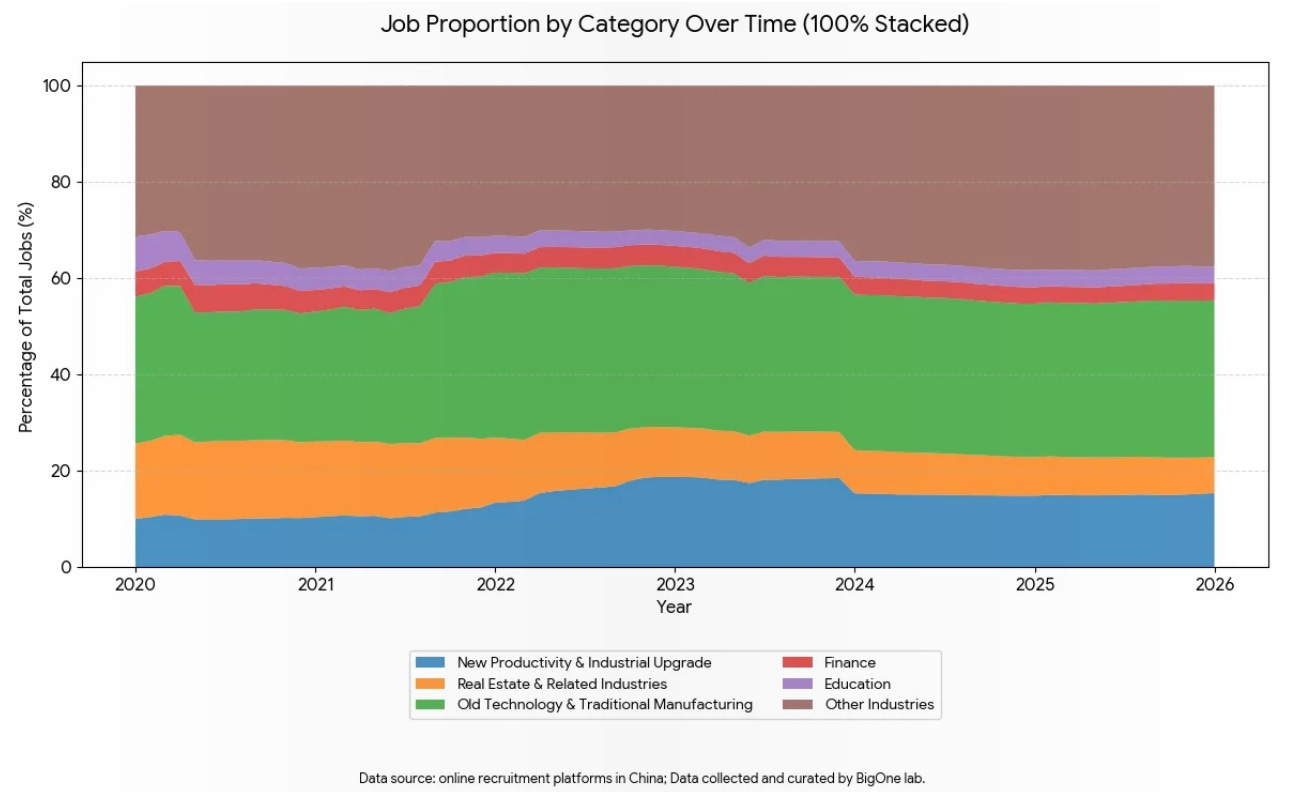
In the previous post, we also observed from job posting data that the real estate and related industries (the orange area) saw their share of total recruitment cut in half, dropping from 15% in 2020 to less than 8% by the end of 2025.

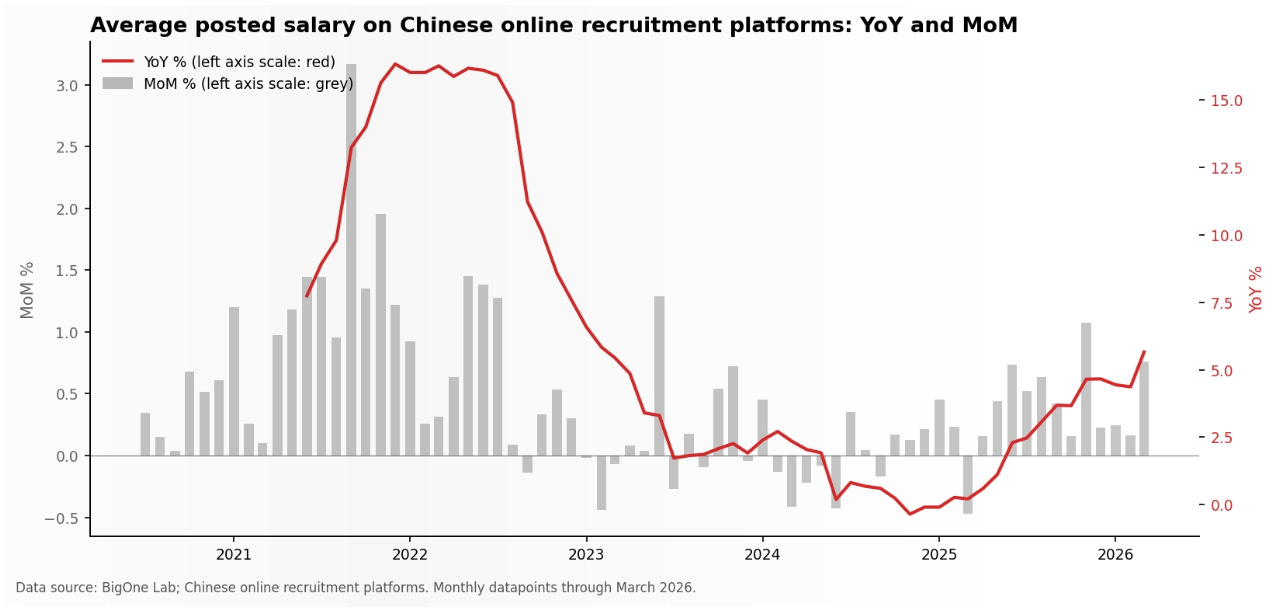
Salaries: healthy growth in March
Average posted salaries on Chinese online recruitment platforms bottomed in November 2024 and have accelerated almost every month since.
March 2026 printed +5.7% YoY — the strongest reading since mid-2022 — with MoM momentum also picking up.
Two caveats: the data sample can skew toward while-collar roles. Additionally, the salary growth may not be even across industries. As we’ve previously pointed out (see Old to New), higher-paying “new productivity” jobs in tech and AI-adjacent roles are crowding out lower-paying ones.
But even after adjusting for both, a full year of accelerating wage growth is a meaningful break from 2023–24.
A note to readers: We recently launched Baiguan Pro, a professional tier for investors seeking more in-depth analysis directly related to Chinese equities. There, we share our team’s monthly view on Chinese assets, built on macro data points like these, along with other proprietary data and market inputs. If the Charts of the Week help you calibrate the China investment, Baiguan Pro takes it a step further.
Interested readers can read the inaugural post here.


